
You do not need a four-year degree to get into renewable energy analytics. If I already know field work, safety rules, maintenance logs, SCADA, or power systems, I can use that background to move into data-focused energy jobs.
Here’s the article in plain terms:
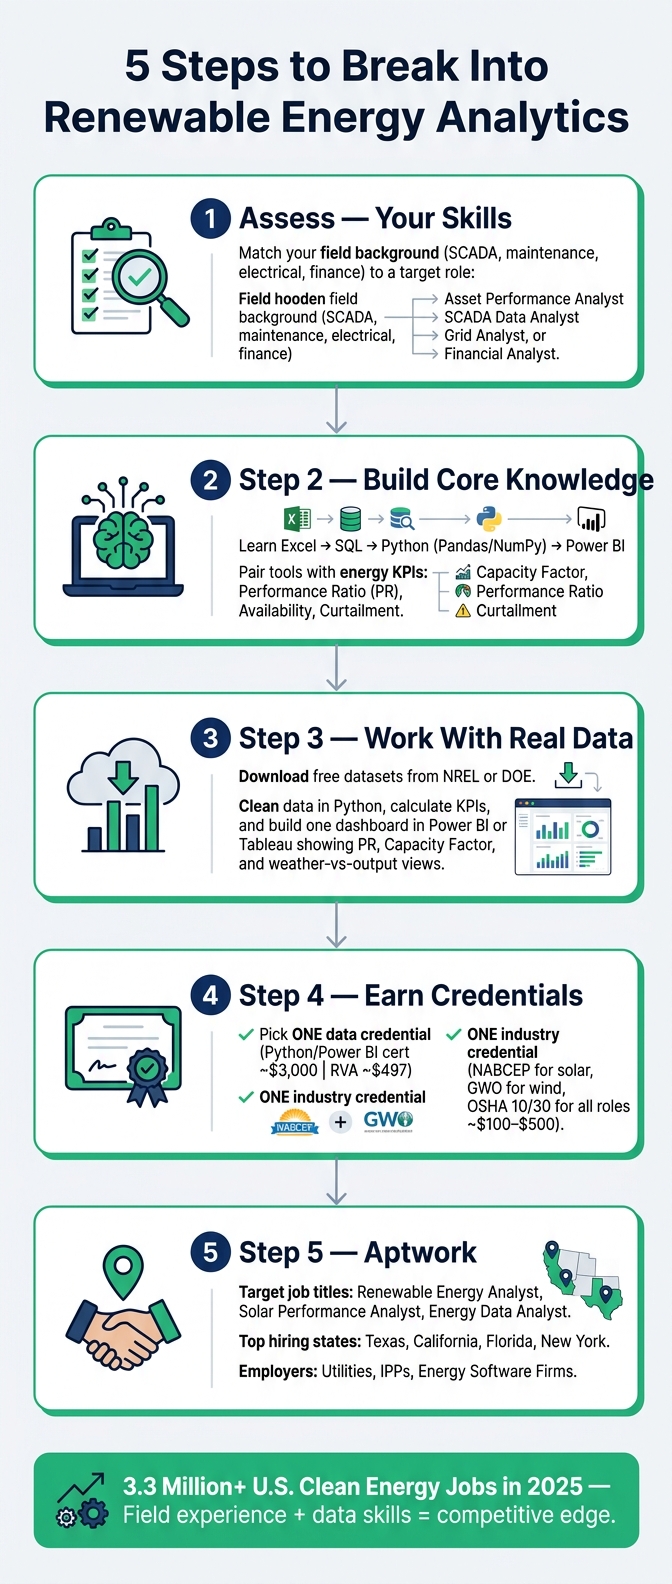
- I start by matching my past work to a target role, like asset performance, SCADA data, grid analysis, or energy finance.
- Then I learn the core tools: Excel, SQL, Python, and Power BI.
- I pair those tools with power-sector basics like solar output, wind performance, battery dispatch, Capacity Factor, PR, Availability, and Curtailment.
- Next, I use public U.S. energy datasets from sources like NREL and DOE to build a small portfolio project.
- After that, I add one data certificate and one industry or safety credential such as NABCEP, GWO, OSHA 10/30, or NFPA 70E.
- Last, I update my resume, show project work, and apply to employers like utilities, power producers, and energy software firms.
A few numbers stand out. The U.S. clean energy sector had 3.3 million+ jobs in 2025, and many firms still struggle to fill roles that mix data skills with power-sector knowledge. That means my field experience can help if I back it up with proof: a project, a few tools, and the right training.
If I had to boil the whole article down to one line, it’s this: pick one target role, learn a small set of tools, build one solid project, and use my field background as proof that I understand how the data connects to the equipment.
5 Steps to Break Into Renewable Energy Analytics
1. Assess Your Current Skills Against Renewable Energy Analytics Roles
Define the Roles You Want to Target
Before you try to close any skill gaps, get clear on the role you want. The best place to start is usually the role that lines up most closely with the work you already do.
| Your Background | Closest Analytics Role | What You’d Analyze |
|---|---|---|
| Maintenance / Mechanical | Asset Performance Analyst or Predictive Maintenance Analyst | Vibration and temperature sensor data, equipment failure probability |
| Electrical / Controls / SCADA | Operations Analyst or SCADA Data Analyst | Turbine telemetry, power curve modeling, real-time monitoring |
| Grid / Utility Operations | Grid Analyst or Utility Planner | Load profiles, duck curve patterns, battery storage integration |
| Spreadsheets / Project Finance | Financial or Business Analyst | LCOE, NPV, IRR, PPA pricing, project feasibility |
Pick the row that fits your past work best. That gives you a clear starting point instead of trying to aim at everything at once.
List Your Transferable Field and Safety Experience
Go through your work history and mark every item that applies to you. Each one connects to a real analytics task.
- ☐ Worked with a SCADA system in any capacity
- ☐ Logged or reviewed maintenance records or work orders
- ☐ Operated or maintained equipment as field staff at a solar farm, wind site, substation, or industrial facility
- ☐ Held or currently hold OSHA 10/30 or NFPA 70E certification
- ☐ Monitored inverters, turbines, or gearboxes
- ☐ Tracked CAPEX/OPEX budgets or used financial reports or dashboards
- ☐ Read or interpreted sensor data, alarms, or performance dashboards
SCADA experience, for example, maps straight to data engineering roles because it gives you firsthand knowledge of how raw operational data is generated at the source. Safety credentials like OSHA and NFPA 70E matter too. They show you understand the on-site limits that come with managing physical assets.
Identify the Skill Gaps You Need to Close
Now look at the list below and mark the items you can’t do with confidence today. Those are the gaps to focus on in Step 2.
- ☐ Write basic SQL queries to pull and filter data from a database
- ☐ Use Python, especially Pandas or NumPy, for data cleaning and analysis
- ☐ Build a simple chart or dashboard in Power BI or Tableau
- ☐ Explain how solar PV, wind turbines, or battery storage systems work at a basic level
- ☐ Calculate or interpret KPIs like Capacity Factor, Performance Ratio (PR), or Availability
The most common gaps are Python, SQL, and BI tools like Power BI or Tableau. If you’re aiming for reporting roles, put Power BI and Excel first. If you want predictive or data-focused work, start with Python and SQL. That way, Step 2 can focus on what will help you most first.
sbb-itb-aa28329
2. Build Core Data and Energy Systems Knowledge
Learn the Data Skills Used in Entry-Level Analytics Work
Start with the tools that line up with the gaps you found in Step 1. Begin with Excel and SQL. Excel helps you clean messy data. SQL helps you query operational logs and SCADA data.
Next, move to Python, especially Pandas and NumPy. That’s where you’ll work with sensor data and calculate KPIs. After that, use Power BI or Matplotlib to turn the numbers into dashboards people can actually use.
| Learning Phase | Tool | What You’ll Do With It |
|---|---|---|
| Phase 1 | Excel & SQL | Clean data, query operational and maintenance logs |
| Phase 2 | Python (Pandas/NumPy) | Manipulate sensor data, calculate KPIs |
| Phase 3 | Power BI / Matplotlib | Build dashboards for PR and availability |
| Phase 4 | Time-Series Analysis | Identify seasonal patterns and forecast generation |
Use Anaconda or Jupyter Notebooks for Python work. Energy datasets can get big fast, and having the right setup makes the work much easier.
Learn How Solar, Wind, Storage, and the Grid Work
Don’t learn the tools in a vacuum. Pair each one with the system it will help you analyze. You need a working grasp of how each asset type generates, stores, and delivers power, plus the common ways things go wrong. That’s what helps the data make sense.
Here are a few core areas to know:
- Solar PV: irradiance, module temperature, degradation
- Wind: yaw misalignment, blade pitch, wake effects in SCADA data
- Battery storage: dispatch strategy, state of charge
- Grid: load profiles, peak demand, curtailment: output reduced because of grid constraints
Across all asset types, get comfortable calculating and interpreting Capacity Factor, Performance Ratio (PR), Availability, and Curtailment. These show up all the time in entry-level analytics work.
Practice Both Skill Sets With a Simple Exercise
A small practice project goes a long way. Use one sample hourly generation dataset or weather file, then work through it in Python or Excel. Calculate Capacity Factor for a one-month period, plot hourly output to spot the day-by-day generation curve, and flag any hours where output drops to zero when it shouldn’t.
That one exercise pulls together data cleaning, one core KPI, time-series visualization, and basic anomaly detection. In other words, it looks a lot like the kind of work you’d do on the job. It also gives you a solid portfolio example to talk through in interviews.
What is an Energy Data Analyst?
3. Get Hands-On Experience With Real Renewable Energy Data
Use a real dataset to prove you can do the work. This is where the practice from Step 2 turns into something you can show an employer.
Analyze a Public Dataset and Document Your Process
Take the Excel, SQL, and Python basics from Step 2 and use them on a public dataset. The National Renewable Energy Laboratory (NREL) and the Department of Energy (DOE) both offer free U.S. renewable energy data. If you’re just starting out, stick with data tied directly to generation, like solar irradiance, wind speed, and ambient temperature. If you want to look at grid operations or storage, data from public utilities, grid operators, and smart meters can help too.
Pick a sample solar, wind, or grid dataset and go through the whole workflow. Clean it in Python with Pandas. Fix missing values. Remove bad readings. Resample the data into hourly or daily averages. Then use the cleaned dataset to compare PR and Capacity Factor across days, weeks, or sites.
After that, write a short summary or build a simple slide deck that explains what you found and what it means in plain English. That’s the part that turns a basic exercise into a portfolio piece. It shows you can do more than run code. You can also explain the result to someone who doesn’t live in spreadsheets all day.
Use the cleaned dataset to test whether output lines up with what you’d expect.
Work Through Common Performance-Analysis Scenarios
One common entry-level task is comparing expected output with actual output. For solar, you can model output from irradiance and temperature, then measure error with MAE or RMSE. If the gap gets too large, that can point to performance issues or equipment failure.
For wind, plot wind speed against turbine production with a scatter chart. The pattern should stay fairly steady. If points start drifting away from that expected shape, something may be off. That could mean a performance problem, a sensor issue, or trouble with the equipment itself.
This kind of work helps you see how problems show up in operating data, not just in theory.
Build One Simple Dashboard for Your Portfolio
Now turn the analysis into one dashboard you can share. Keep it simple. Build it in Power BI or Tableau, and use Python and Matplotlib for the analysis and charts behind it.
Focus on the metrics that matter most:
- Performance Ratio
- Capacity Factor
- Availability
- Curtailment
- A weather-versus-output view, like irradiance against generation for solar or wind speed against production for wind
Put your charts, screenshots, and short written summary into one clearly labeled folder. Use file names and section labels that make sense at a glance. When you start applying for jobs, you’ll have a work sample that shows actual analysis, not just that you’ve opened the tools before. That’s a big difference.
| Dashboard Component | What to Include |
|---|---|
| KPI Cards | Performance Ratio (PR), Capacity Factor, Availability, Curtailment |
| Weather vs. Output | Irradiance vs. power scatter plot (solar); wind speed vs. production and wind rose (wind) |
| Time Series | Daily, monthly, and annual generation trends; rolling averages |
| Asset Health | Anomaly detection flags and maintenance log summaries |
4. Earn Recognized Credentials and Safety Training
Once your portfolio shows real work, credentials help back it up. They show employers that your skills aren’t just theoretical. The simplest move is to choose one data credential and one industry credential that fit the role you want.
Pick One Analytics Credential and One Energy-Specific Training Path
On the analytics side, pick one short certificate in Python, Power BI, or energy analytics. A 5-day intensive program costs about $3,000.
If you’re aiming for project finance and valuation, the Renewables Valuation Analyst (RVA) Certification is a strong fit. It costs $497 for lifetime access and focuses on the models lenders use for solar, wind, hydro, and battery energy storage projects.
On the energy side, choose training that lines up with your sector:
- NABCEP PV Installation Professional is widely recognized in U.S. solar
- Global Wind Organisation (GWO) Basic Safety Training is the standard for people working on wind turbine sites
If you’re headed into solar, go with NABCEP. If wind is your lane, GWO makes more sense.
Keep Job-Site and Electrical Safety Credentials Current
A lot of analytics roles aren’t desk-only. You might be helping field teams, checking SCADA data, or working with sensor data tied to physical assets. That’s why it helps to keep OSHA 10/30, electrical safety, high-voltage safety, and fall protection current – especially for jobs tied to grid integration, energy storage systems, or substation work.
Coming from oil and gas or heavy construction? Put that safety background near the top of your resume. It can carry more weight than people think, especially when the job involves site access or work around energized equipment.
Compare Training Options by Time, Cost, and Job Fit
| Certificate Type | Skill Focus | Typical Duration | Typical Cost (USD) | Best For |
|---|---|---|---|---|
| Data Analytics (Energy Focus) | Python, Power BI, ML, Forecasting | 5 Days – 8 Weeks | $3,000 – $12,000 | Career shifters from IT or Engineering |
| RVA | Project finance, valuation | 3 – 6 Months | $497 | Investment Analysts and Developers |
| Solar PV (NABCEP) | PV Installation, System Design | 3 – 6 Months | Varies (VET TEC eligible) | Trades workers moving to solar ops |
| Wind Safety (GWO) | Basic Safety Training | Short-term | Varies | Wind technicians and site ops |
| Safety (OSHA 10/30) | Job-site safety, Electrical safety | 2 – 5 Days | $100 – $500 | All roles involving site visits |
5. Position Yourself for U.S. Renewable Energy Analytics Jobs
With your portfolio and credentials in place, the next step is simple: move from proof to placement.
Update Your Resume and Portfolio for Analytics Roles
Put Python, SQL, and BI tools near the top of your resume. In most energy analytics roles, that means Python (Pandas, NumPy), SQL, Power BI, and DAX should be easy to spot right away.
Then add two to four project summaries. Keep each one tight. Show your role, the tools you used, and the result you helped drive.
If you’re coming from field work in oil and gas, construction, utilities, or another hands-on part of the energy world, don’t hide that background. Put it to work. Frame that experience around system reliability, performance monitoring, troubleshooting, and regulatory compliance.
Why does that matter? Because many energy analytics teams support live operations. They don’t just want someone who can build a dashboard. They also want someone who understands what the numbers mean in the field. That kind of domain knowledge can set you apart from a general data analyst.
Once your resume is in good shape, shift your attention to the people and companies that can help you land the role.
Network in Clean Energy and Infrastructure Circles
After you package your skills, start meeting people already doing the work. Join industry associations, go to regional clean energy events, and look for clean energy hackathons where you can talk with analysts and operations managers face to face.
Informational interviews can help too. A short conversation with someone already working in energy analytics can make the jump from training to a job feel a lot less abstract.
Focus part of your search on active hiring markets such as:
- Texas
- California
- Florida
- New York
These states show up often in hiring activity for energy and power-related roles.
Find Employers and Project Work
Now narrow your search to job titles and employers that line up with your background. Look for roles such as Renewable Energy Analyst, Solar Performance Analyst, Wind Operations Analyst, Energy Data Analyst, and Grid Integration Specialist.
Across the market, hiring tends to cluster around three employer groups:
- Utilities
- Independent power producers
- Energy software firms
Those are some of the main places where these roles show up.
If you’re still building experience, project-based work can help you stay close to the industry while adding analytics-relevant skills. ABLEMKR connects skilled workers to U.S. energy and infrastructure projects where safety credentials, field experience, and technical training all matter. For someone trying to keep one foot in energy while building the next set of skills, that’s a practical option.
Conclusion
You do not need to start from zero in renewable energy analytics. If you’ve worked in construction, utilities, or energy, you already have domain knowledge that employers want. That field context is your edge. The checklist helps you turn it into analytics credibility.
Treat the checklist like a practical sequence, not a theory exercise. Move through it step by step: map your experience, learn data and system basics, practice with real data, earn one analytics credential and one safety credential, then go after U.S. employers.
Start this week. Download a public energy dataset. Review NABCEP or GWO requirements. Practice Python and SQL. Pick one action today and get it moving.
FAQs
How long does it take to become job-ready?
It depends on where you’re starting and which route you take. In most cases, getting job-ready for renewable energy analytics can take a few months to more than a year.
Building the core skills often takes around 3 to 8 months. If you also add hands-on work, certifications, or a degree, that timeline can stretch from 6 months to several years.
What kind of portfolio project should I build first?
Start with a project built around a clear business question and actual energy data. That gives you a strong way to show end-to-end analytics skills.
A solid first option is a renewable energy resource assessment or performance monitoring project using public datasets such as weather data, energy production records, or asset telemetry. Show the full workflow: data cleaning, modeling, visualization, and a short written narrative that explains what you found and what someone should do next.
Which credential matters most for beginners?
For beginners in renewable energy analytics, the credential that matters most is practical technical skill. In entry-level roles, employers often look for hands-on ability with Python, SQL, and BI tools like Power BI or Tableau, plus a basic grasp of energy systems.
A formal degree can help. But it’s not the only path. Online courses, energy data analysis certifications, and industry credentials like NABCEP or GWO can also make a beginner’s profile stronger.


