
Workforce analytics dashboards simplify managing HR data by centralizing information like headcount, productivity, and compliance into one real-time platform. They replace manual processes with automated insights, helping industries like construction and energy avoid disruptions, control costs, and ensure safety compliance.
Key Takeaways:
- Real-Time Insights: Dashboards provide instant updates on workforce allocation, productivity, and safety metrics.
- Automation: They integrate with tools like HRIS and payroll systems, reducing errors and delays.
- Compliance Tracking: Automated alerts for certifications and safety standards prevent costly mistakes.
- Predictive Analytics: Forecast labor needs and address potential issues like turnover or understaffing.
- Key Metrics: Focus on employee utilization, absenteeism, labor costs, and compliance rates to improve decision-making.
Tools like ABLEMKR streamline these processes, offering mobile-friendly solutions for real-time workforce management. These dashboards are essential for improving efficiency, cutting costs, and maintaining safety in high-demand industries.
Workforce Analytics Dashboard Key Statistics and Benefits
Core Features of Workforce Analytics Dashboards
Real-Time Data Visualization
Real-time dashboards transform raw data into actionable insights with detailed drill-down capabilities. This is especially important in industries like construction and energy, where conditions can change in an instant. A delayed shipment, unexpected weather, or equipment failure can disrupt multiple job sites within hours.
Take Work in Progress (WIP) reporting, for example. It allows construction managers to track task-level progress instantly. Instead of waiting for weekly updates, they can see which teams are overworked or underutilized, pinpoint bottlenecks before they derail timelines, and adjust resources on the spot. Another useful feature is geographic distribution mapping, which shows workforce allocation across locations. Bubble sizes represent headcount, while colors indicate whether a site is growing or shrinking.
The move toward multi-device accessibility has also been a game-changer. Field supervisors no longer need to return to the office to check updates. Mobile-friendly dashboards enable them to make informed decisions directly from job sites, whether at a remote pipeline or an active construction zone. Platforms like ABLEMKR take this a step further by using mobile-first technology to match workers to job sites in real time based on availability and location.
This real-time visibility integrates seamlessly with automated data capture systems, ensuring operations run smoothly without interruptions.
Automated Data Collection and Integration
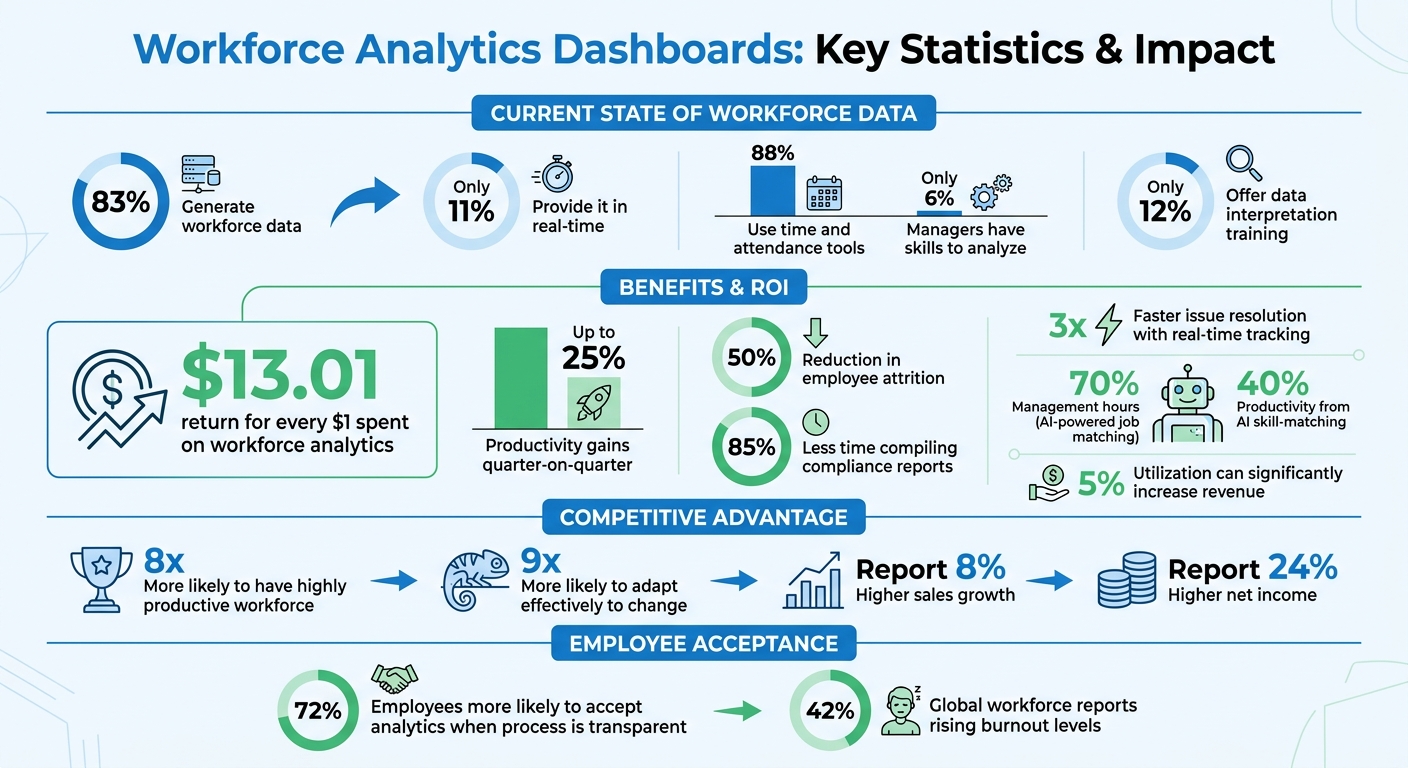
Manual data entry often leads to delays, errors, and wasted time. Dashboards eliminate these inefficiencies by connecting multiple systems – ERPs, CRMs, payroll platforms, and HRIS tools like Workday, SAP SuccessFactors, and ADP – into a unified data hub. This integration ensures that both field teams and office staff work from the same accurate dataset. Currently, about 88% of organizations use time and attendance management tools, and automated data flow significantly reduces errors while streamlining operations for teams managing hundreds of workers across various locations.
ABLEMKR’s platform illustrates this by integrating payroll directly with worker deployment data, bridging the gap between the field and back-office operations.
Automation also plays a crucial role in budget management. Dashboards can set project or client-specific budget limits and trigger alerts when labor costs are about to exceed these thresholds. This allows managers to make adjustments before costs spiral out of control, avoiding last-minute damage control.
Such seamless integration also strengthens compliance tracking, which is vital in high-risk industries.
Compliance and Certification Tracking
In industries like construction and energy, expired certifications or incomplete safety training can halt operations and lead to hefty penalties. Dashboards address this by centralizing compliance data, tracking certification expirations, and flagging potential audit issues. This ensures adherence to OSHA standards and other safety regulations. Automated alerts notify managers about upcoming certification expirations, overdue training, or missing forms.
Organizations using automated dashboards report spending 85% less time compiling compliance reports and resolving issues three times faster thanks to real-time tracking.
"A dashboard brings together all your compliance data in one place – deadlines, control status, audit issues, regulatory updates – giving you visibility across departments and geographies." – MetricStream
Platforms like ABLEMKR enhance this process by ensuring that workers are assigned to job sites based not only on availability but also on their current certifications and safety training. This avoids costly mistakes, such as deploying a crew only to discover they lack the necessary qualifications. Additionally, audit-ready exports simplify regulatory inspections, providing comprehensive documentation without manual effort.
sbb-itb-aa28329
Power BI Workforce Analytics Dashboard Setup | Full Tutorial
Key Metrics and KPIs for Workforce Analytics
Metrics turn data into insights that drive better decisions. Dashboards are only effective if their KPIs influence daily operations, safety, and budgets. Interestingly, while 83% of organizations generate workforce data, only 11% provide it in real-time. This delay forces managers to react to issues rather than prevent them. The following metrics help bridge that gap.
Metrics for Operational Efficiency
Operational efficiency metrics focus on improving productivity and revenue. One key measure is the employee utilization rate, which shows how much available work time is spent on productive tasks. The formula is straightforward: (Productive Hours ÷ Available Work Hours) × 100. For industries like construction and energy, even a 5% boost in utilization can significantly increase revenue. This metric highlights inefficiencies, such as idle crews or overloaded teams.
Another critical indicator is scheduling effectiveness, which compares scheduled hours to actual logged hours, including exceptions like missed punches. For example, when a 40-hour schedule results in only 32 hours of logged work, it points to inefficiencies.
Time-to-onboard measures how quickly new hires reach full productivity. Faster onboarding enhances engagement and retention. Platforms like ABLEMKR simplify this process by pre-vetting workers and managing certifications ahead of time, reducing delays between hiring and deployment.
While operational metrics improve workflow, safety and compliance metrics ensure a secure and regulated work environment.
Safety and Compliance Metrics
Training completion rate tracks the percentage of workers who finish required safety or compliance programs. Incomplete training not only increases audit risks but also raises the chances of workplace accidents. Dashboards can flag workers nearing the expiration of certifications like OSHA 30, confined space entry, or hazmat handling.
Absenteeism rate measures the percentage of missed workdays: (Total Absent Days ÷ Total Available Workdays) × 100. High absenteeism often signals deeper problems like disengagement or burnout. Unplanned absences lower team productivity and morale. Dashboards that identify patterns – such as frequent absences on certain shifts or sites – enable managers to address issues early.
Corrective action closure rate measures how quickly identified safety hazards are resolved. Faster resolution times reflect a proactive safety culture. Dashboards that track near-misses alongside recordable incidents help prevent minor hazards from escalating into major injuries.
Safety metrics are crucial, but understanding their financial impact adds another layer of insight.
Financial Metrics
Financial metrics evaluate the cost-effectiveness of workforce management. Labor cost per employee calculates the average expense of wages, benefits, and overtime. This metric helps managers compare the cost of current staff to the potential expense of hiring additional workers. Similarly, overtime cost – calculated as Overtime Hours × Overtime Pay Rate – often highlights that hiring new employees may be more cost-effective than consistently paying overtime.
Revenue per employee (Total Revenue ÷ Total Number of Employees) acts as a high-level productivity metric. It also helps identify time leakage, such as employees spending too much time on internal tasks instead of revenue-generating activities. Companies that excel in people analytics report 8% higher sales growth and 24% higher net income compared to their competitors.
"There’s a world where there’ll be winners and losers, managers and organizations who really harness the power of data about people and understand that people data is business data." – Paul Rubenstein
Tools like ABLEMKR integrate payroll and deployment data in real time, eliminating the need for manual reconciliation and ensuring accurate cost tracking.
These metrics form a solid foundation for refining dashboards and driving strategic decisions.
How to Implement Workforce Analytics Dashboards
Steps to Successful Deployment
To get started with workforce analytics dashboards, consider launching a pilot program over 8–12 weeks. Here’s a suggested timeline:
- Weeks 1–4: Map out data sources and build your Minimum Viable Dataset (MVD).
- Weeks 5–9: Develop predictive models for key metrics like turnover rates and hiring forecasts.
- Weeks 10–12: Operationalize the system with automated alerts and playbooks.
This phased approach keeps the process manageable and avoids overwhelming complexity.
Your MVD should include key fields like Employee IDs, hire and termination dates, role or job codes, location or cost center, time worked or project hours, and manager IDs. These data points are essential for calculating attrition rates, planning capacity, and evaluating manager-level performance. If these core areas aren’t clean and reliable, the insights generated by even the most advanced dashboards will be flawed.
Collaboration is crucial. Bring together representatives from HR, Finance, and IT, and assign an executive sponsor to ensure that headcount forecasts align with broader business goals like P&L and capital plans. For example, Ascension Health used workforce analytics to model the financial impact of raising nurse pay rates from 80% to 100% of market levels. By evaluating both the cost of the pay increase and the projected drop in involuntary turnover, they presented leadership with a comprehensive analysis that directly shaped compensation strategies.
Before rolling out predictive models, validate them through back-testing against historical data to measure accuracy using metrics like Mean Absolute Percentage Error (MAPE). This step helps identify and correct any faulty assumptions before they impact decision-making.
Once your pilot program is in place, focus on clear communication and user-friendly design to encourage adoption.
Best Practices for Adoption
Transparency plays a big role in getting employees on board. Research shows that 72% of employees are more likely to accept analytics when the process is transparent. Clearly explain what metrics are being tracked and why. Sharing dashboards with employees can shift perceptions – turning analytics from a surveillance tool into something that benefits them personally. For instance, showing how dashboards can identify burnout risks or highlight better-paying opportunities can significantly reduce resistance.
Simplicity is equally important. Each chart should answer one operational question. Train HR Business Partners to interpret dashboards and identify actionable triggers. Use straightforward visual indicators like red, yellow, and green to help managers quickly assess and address issues. This is especially critical since only 6% of managers currently have the skills to analyze and explain data, and just 12% of companies offer data interpretation training.
Automated alerts can streamline action. For example, when predicted headcount shortfalls exceed 10%, alerts can trigger requisition openings or redeployment requests automatically. Companies that embrace workforce analytics report impressive outcomes, including a return of $13.01 for every $1 spent, productivity gains of up to 25% quarter-on-quarter, and a 50% reduction in employee attrition.
Scaling Dashboards for Complex Operations
Once the initial deployment is successful, scaling the dashboard requires moving from descriptive to predictive analytics. Organizations with advanced people analytics capabilities are 8 times more likely to have a highly productive workforce and 9 times more likely to adapt effectively to change.
To scale effectively, centralize your HRIS data in a dedicated warehouse, such as Azure SQL or Snowflake, to ensure consistent reporting and reliable model training. Implement Row-Level Security to control data access based on organizational roles. For instance, HR Business Partners should only access data for their departments, while executives can view the entire reporting structure. To protect privacy, use aggregation thresholds that suppress data for groups smaller than five employees, especially in industries like construction and energy where workforce sizes often fluctuate.
Establish clear data governance by appointing a data steward and setting service-level agreements (SLAs) for data refreshes and model recalibration – quarterly updates are a good starting point. Publish a central semantic layer with standardized measures like FTE, headcount, and vacancy days to prevent inconsistent reporting across regions. For industries with large, mobile workforces, integrating GPS or geofencing for attendance tracking, along with global payroll signals, can dramatically improve real-time labor forecasting accuracy. Tools like ABLEMKR already incorporate these features, minimizing manual reconciliation and enabling faster scalability across multiple job sites.
"People analytics is not about replacing human judgment with algorithms. It is about giving HR leaders the evidence base to make better decisions faster." – ECOSIRE Team
Advanced Features for Workforce Optimization
Predictive Analytics for Workforce Demand
Modern dashboards go beyond just reporting past performance – they help predict future workforce needs. This shift from reacting to planning ahead is made possible through predictive analytics, which forecasts labor requirements and helps prevent staffing shortfalls.
A key method used here is multiple linear regression, which combines historical workforce data with operational metrics like project timelines and volume. This allows organizations to estimate labor needs over a 1-to-3-year period. For example, industries like construction and energy can forecast crew requirements based on project schedules, such as pipeline maintenance or mine development phases.
Another technique, survival analysis, identifies when specialized employees are most likely to leave. By analyzing factors like tenure, performance trends, compensation competitiveness, and even commute distances, dashboards can flag employees at risk of resigning. This is especially useful in fields like energy and engineering, where voluntary attrition rates often range between 15–20% annually. For instance, survival curves can predict the likelihood of a certified welder staying for one year, three years, or longer, enabling managers to focus retention efforts strategically.
Markov chain modeling takes a deeper look at internal labor supply by analyzing promotion trends, job transitions, and exit rates over a 2-to-5-year horizon. To handle uncertainties – like fluctuating project demands or varying attrition rates – Monte Carlo simulations are employed to model different scenarios.
Another helpful tool involves employee engagement scores, which can act as early indicators of future turnover. By comparing engagement levels with subsequent attrition rates, companies can intervene early to reduce staffing gaps.
For these predictive models to work effectively, sample sizes are crucial. For instance, regression-based attrition models typically need at least 300–500 employees per segment to ensure accurate predictions.
These forecasting tools set the stage for the next step: using AI to assign workers to projects with precision.
AI-Powered Job Matching
AI-powered systems revolutionize how workers are assigned to projects, replacing manual scheduling with real-time, data-driven decisions. These systems consider factors like certifications, safety training, availability, and location, which is especially valuable in industries like construction, oil and gas, and mining. Whether it’s a last-minute shutdown or a remote pipeline repair, AI ensures the right people are deployed quickly.
This approach not only saves time – cutting management hours by up to 70% – but also boosts productivity by as much as 40% by aligning skills with needs in real time. It’s a seamless way to connect accurate labor forecasts with efficient crew deployment.
Where AI truly stands out is in dynamic redeployment. When unexpected events occur, like sudden absences or equipment failures, AI can instantly identify nearby qualified workers and reassign them. It also evaluates the feasibility of hiring plans by comparing internal demand with external labor market conditions. For instance, if a company anticipates needing 50 certified riggers in West Texas next quarter, the AI can assess whether that’s achievable based on historical hiring data and current market trends.
Platforms like ABLEMKR integrate these capabilities directly, matching pre-vetted workers to job sites based on their certifications, training, and location. This ensures quick, compliant crew mobilization across U.S. energy corridors.
Before implementing AI matching, it’s critical to standardize your data – roles, skills, and locations need to be organized into a consistent framework. Regularly reviewing AI outputs is also essential to prevent biases in deployment recommendations.
Real-Time Compliance Automation
To complement AI-driven strategies, real-time compliance automation ensures safety and regulatory requirements are met continuously. Instead of relying on spreadsheets or periodic checks, advanced dashboards monitor compliance metrics in real time and send alerts when thresholds are breached.
Tracking certifications and training is a key part of compliance. Dashboards automatically monitor expiration dates for licenses, OSHA certifications, and other required training, ensuring that unqualified personnel aren’t assigned to critical tasks. This is especially important in high-risk industries like construction and energy, where workers often hold multiple certifications with varying renewal schedules.
Automated alerts further enhance safety by addressing risks before they escalate. For instance, if a crew exceeds the maximum allowable hours under Department of Transportation regulations, the system can flag the issue immediately. Considering that 42% of the global workforce reports rising burnout levels, monitoring workload is essential for maintaining both safety and compliance.
Data privacy is another focus, achieved through methods like row-level security (RLS) and data masking. These techniques help organizations comply with regulations such as GDPR, CCPA, and HIPAA. Dashboards also suppress data for small groups to protect individual privacy.
Real-time compliance tools also support pay equity and legal risk management. Dashboards can identify pay gaps early, providing evidence for corrective actions before issues escalate into lawsuits.
"When pay equity gaps are quantified before they become lawsuits, and when engagement trends are tracked before they become culture crises, the HR function moves from reactive to strategic." – ECOSIRE Team
Safety metrics are integrated directly into operational dashboards, offering instant visibility into workplace safety across multiple job sites. Automated alerts ensure that incident rates remain within acceptable limits, providing a proactive approach to managing safety risks.
Organizations that excel in people analytics are 8 times more likely to maintain a highly productive workforce and 9 times more likely to adapt effectively to change. Real-time compliance automation plays a crucial role in transforming compliance from a tedious, manual task into a strategic advantage.
Conclusion: Getting the Most from Workforce Analytics Dashboards
Workforce analytics dashboards aren’t just tools – they’re game-changers for staffing operations. By shifting from a reactive approach to a more strategic one, these dashboards allow organizations to anticipate needs and allocate skilled workers effectively. Research shows that organizations with advanced analytics practices are 8 times more likely to have a highly productive workforce and 9 times more likely to adapt smoothly to change. Leveraging these insights can help you address challenges before they arise and revolutionize decision-making.
What sets these dashboards apart is their ability to go beyond basic reporting and deliver actionable insights. With real-time data on worker availability, certification tracking, and staffing forecasts, you can move from making educated guesses to making informed, evidence-based decisions. This approach not only cuts costs but also enhances safety and ensures operational continuity – even during unexpected disruptions.
In industries like construction, energy, oil and gas, and mining, the stakes couldn’t be higher. Features like real-time compliance monitoring, precise certification-based matching, and proactive demand forecasting are essential for keeping operations running smoothly. ABLEMKR is a standout example, integrating staffing, compliance, and payroll data into a single, agile system that operates in real time.
The real value of analytics lies in how they influence actions. Dashboards are most effective when they drive meaningful change – whether it’s identifying employees who need coaching, optimizing schedules to reduce overtime, or activating backup teams during emergencies. To maximize impact, focus on the metrics that matter most, ensure key systems are integrated, and act swiftly on the alerts your dashboards provide.
FAQs
What data do I need to start a workforce analytics dashboard?
To craft a workforce analytics dashboard, start by collecting key internal HR data. This includes metrics like headcount, turnover rates, time-to-fill open positions, and employee performance statistics. Adding external data, such as labor market trends, can provide a broader perspective and enhance your analysis.
Gather this information from reliable sources like HRIS systems, payroll records, and performance logs. Aim to include both descriptive data (e.g., current headcount) and predictive insights (e.g., attrition forecasts).
When designing your dashboard, focus on visualizing critical metrics such as diversity, attrition rates, and recruitment efficiency. These visualizations help leaders make informed, data-driven decisions that align with organizational goals.
How do I connect HRIS, payroll, and time tracking into one dashboard?
To bring together HRIS, payroll, and time tracking into one unified dashboard, opt for platforms that offer built-in connectors or APIs. These tools ensure smooth data sharing across systems. With modern HR platforms, you can centralize workforce data, giving you real-time insights into metrics such as headcount, payroll, and attendance. After integration, you can tailor the dashboard to display and manage all critical data in one view, streamlining operations and supporting better decision-making.
How can dashboards protect worker privacy while staying real-time?
Dashboards balance worker privacy with real-time insights by using methods like data anonymization and aggregation. These approaches reveal trends while keeping individual details hidden. Role-based access controls add another layer of security, ensuring that only those with the proper permissions can view sensitive information. By minimizing the display of personally identifiable information (PII) and concentrating on operational metrics, organizations can safeguard privacy while still making timely, well-informed decisions.


