
If you want the short answer, here it is: U.S. construction is short on workers, and visa rules are part of the problem.
I see the article making one main point: construction demand is outpacing legal worker supply. The numbers are hard to miss. The industry needs 349,000 net new workers in 2026, while net international migration is projected at 321,000 by mid-2026. At the same time, 92% of construction firms say they have trouble finding qualified workers, and 45% tie that shortage to project delays.
Here’s the article in plain English:
- Immigrant labor is a big part of construction, especially in residential trades like drywall, roofing, and painting.
- Visa options do not match how construction hiring works.
- Enforcement surges shrink the labor pool fast.
- One study found construction employment fell 2.2% on average in affected cities.
- In places with longer enforcement surges, the drop was close to 4%.
- The effects spread beyond one crew or one site.
- construction staffing gets harder.
- Schedules slip.
- Costs climb.
- Housing output slows.
Survey: Immigration crackdown worsens worker shortages in construction industry
sbb-itb-aa28329
Quick Comparison
| Topic | What the article shows |
|---|---|
| Worker demand | Construction needs 349,000 new workers in 2026 |
| Immigrant role | Immigrants are 26.3% of the total construction workforce |
| H-2B | Temporary, capped at 66,000, and often a poor fit for year-round work |
| EB-3 | Better fit for long-term staffing, but too limited and slow |
| Enforcement effects | Job losses, worker fear, delays, and added project costs |
| Main takeaway | The visa system does not line up with construction labor needs |
My read: the article is not just about immigration policy. It is about whether builders can staff jobs, keep projects on schedule, and control costs. That is the lens the rest of the piece uses.
Research Scope, Methods, and Labor Shortage Evidence
Sources, Time Frame, and Inclusion Criteria
This review pulls from administrative payroll data, ACS workforce data, industry evidence, and academic research. The main focus is on visa constraints and enforcement shocks as the policy changes under study. Core sources include Brookings’ 2026 analysis, NAHB/Census ACS estimates, AGC industry evidence, and Cox and East’s 2026 NBER paper.
To make the evidence tighter, the review only includes studies that connect a policy change to a measurable construction labor outcome. Studies that only describe workforce mix were left out.
Brookings uses a staggered difference-in-differences (DiD) design. It compares "surge cities" in the top 25% of ICE arrest increases in early 2025 with non-surge cities. Researchers also re-estimated the findings using year-over-year employment growth to cut seasonal noise. On top of that, they compared actual job losses with a counterfactual removal scenario to estimate excess losses tied to operational disruption and chilling effects that deter documented and native-born workers.
That screening step matters. It narrows the evidence to research showing how policy shifts turn into labor losses, wage pressure, or project delays.
What Studies Show About Worker Shortages
The picture is pretty clear: construction remains exposed to any policy that cuts immigrant access.
Using that filter, the studies show that visa restrictions and enforcement shocks hit a labor market that was already tight. Construction job openings hit a low point in August 2025, then climbed by 90,000 in November. That swing shows how fast shortages can get worse when worker supply shrinks. Immigrant shares are highest in residential trades like drywall and roofing.
In the seven U.S. metro areas with the most homebuilding permits from 2019 to 2023, foreign-born workers made up an average of 54% of the trades workforce.
The Role of Immigrant Labor in Construction
Foreign-born workers are a core part of construction staffing, especially in residential trades. In 2024, immigrants accounted for 26.3% of the total U.S. construction workforce.
| Occupation | Immigrant Share of Workforce | Primary Segment |
|---|---|---|
| Drywall Installers | 57% | Residential |
| Roofers | 53% | Residential |
| Painters | 48% | Residential |
| Carpet/Floor Workers | 43% | Residential |
| Construction Trades (Avg.) | 33%–35% | Mixed |
| Structural Iron/Steel Workers | 16% | Nonresidential |
| Heavy Equipment Operators | 14% | Infrastructure |
Enforcement shocks don’t stop at one job type. They also reduce hiring in related roles. In cities that saw ICE enforcement surges in early 2025, construction employment fell by an average of 2.2%, or about 102,000 lost jobs across 86 surge cities. Cox and East’s 2026 NBER working paper finds that construction is the hardest-hit industry when enforcement activity rises, and that employment among likely undocumented workers fell 7.5% in raid areas.
The spillover effect is hard to ignore. The share reporting fear of detention rose among naturalized citizens from 12% to 31%, and among lawfully present immigrants from 33% to 50%, between 2023 and 2025. Lost immigrant labor also reduces demand for U.S.-born workers in related roles, which lowers total headcount.
Visa Pathways Used in Construction and Their Limits
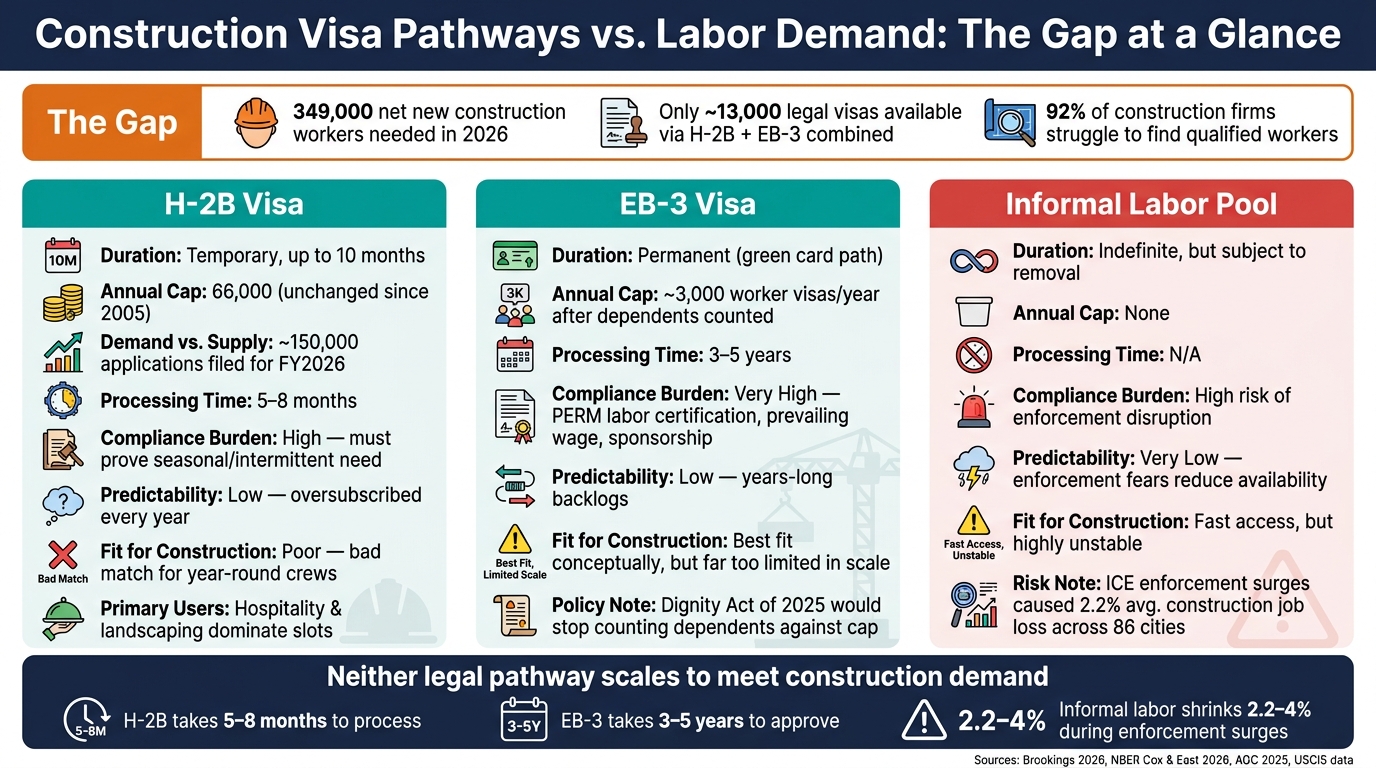
H-2B vs EB-3 vs Informal Labor: Construction Visa Gap Explained
H-2B and EB-3 in Construction Staffing
Construction’s labor problem isn’t just about finding workers. It’s also about whether the legal visa options line up with how construction jobs actually work.
The two visa routes most often mentioned in construction staffing are H-2B and EB-3. On paper, they sound like answers. In practice, both are a rough fit when contractors need to staff crews across many projects.
H-2B is a temporary, seasonal program. That makes it a poor match for crews needed year-round. EB-3 is a green card path for permanent full-time roles like concrete laborers, carpenters, and equipment operators. Because workers can seek permanent residency after sponsorship, EB-3 lines up better with long-term staffing needs. But the yearly supply is far too small for construction demand.
Only 10% of construction firms use H-2B or other temporary work visa programs today, which means most employers still depend on domestic labor or undocumented workers.
Where the System Creates Friction
The biggest problem isn’t just who qualifies. It’s the mix of caps, backlogs, and timelines that don’t match the pace of construction work.
The 66,000 annual H-2B cap has not changed since 2005. Meanwhile, demand has kept climbing, with about 150,000 applications filed for fiscal year 2026. Most H-2B slots have gone to hospitality and landscaping, so construction firms are left fighting over the rest.
EB-3 has its own limit. The EB-3 "Other Workers" cap leaves only about 3,000 worker visas per year once dependents are included in the count. Put that next to the estimated need for 349,000 net new workers in 2026, and the gap is hard to ignore.
Then there’s the clock. H-2B filings often take 5 to 8 months, while EB-3 sponsorship usually takes 3 to 5 years. That’s a bad fit for an industry where labor needs can shift from one bid cycle to the next.
The Dignity Act of 2025 would stop counting dependents against the EB-3 cap and would also speed federal processing.
The table below shows why neither route fully closes construction’s labor gap.
Visa Channel Comparison Table
These differences affect how fast contractors can move crews into the field – and whether they can staff a project at all.
| Feature | H-2B Visa | EB-3 Visa | Informal Labor Pool |
|---|---|---|---|
| Duration | Temporary, typically up to 10 months | Permanent (green card) | Indefinite, subject to removal |
| Annual Cap | 66,000 | 10,000, shared with dependents | No legal cap |
| Processing Time | 5–8 months | 3–5 years | N/A |
| Compliance Burden | High; requires proof of seasonal or intermittent need | Very high; requires PERM labor certification, prevailing wage determinations, and sponsorship requirements | High risk of enforcement disruption |
| Predictability | Low; oversubscription makes planning difficult | Low; years-long backlogs | Very low; enforcement fears reduce availability |
| Practical Fit for Construction | Poor fit for year-round work | Best fit, but too limited | Available fast, but highly unstable |
What Recent Studies Find About Labor, Wages, Costs, and Delays
Effects on Employment, Vacancies, and Wages
When visa caps tighten and enforcement picks up, construction usually feels it fast. Employment tends to take the first hit. After that, pressure shows up in pay, open roles, and project timing. The pattern is pretty simple: fewer workers are available, and that squeeze arrives all at once.
A 2026 Brookings Institution study found that construction employment fell by an average of 2.2% after ICE enforcement surges. That works out to roughly 102,000 sector jobs lost across 86 U.S. cities. In cities where enforcement lasted six months or longer, the drop deepened to nearly 4%. A 2026 NBER working paper by Cox and East backed up that pattern. It found a 7.5% drop in construction employment among likely undocumented workers after localized ICE raids, along with native-born job losses in related roles ranging from 51,000 to 297,000 in 2025 alone.
The damage doesn’t stop at the jobsite either. For every excess ICE arrest during the 2025 surge, an estimated 13 total jobs were lost across the local economy.
Wages tell a more uneven story. In trades where skilled workers are hard to find, pay has gone up as projects compete for a smaller pool of documented labor. But across the broader residential and commercial market, wage growth has cooled as contractors pull back and demand softens.
Higher pay, in other words, doesn’t solve the labor gap. It often shows up at the same time as slower project starts and a bigger risk of delays.
Effects on Schedules, Costs, and Housing Supply
When workers pull back, projects slow down and budgets take a hit. One 2025 enforcement shock delayed a $20 million project by three weeks and added about $84,000 in liquidated damages. That helps show the "chilling effect" at work. Fear doesn’t stay pinned to one raid or one site. It spreads. Workers across a region may stay home, even if enforcement happened somewhere else, and the labor pool shrinks far beyond the immediate area. A 2025 survey found that one-third of documented immigrants reported avoiding work because of enforcement concerns.
"Immigration enforcement has strengthened since 2024, which has scared their employees away from going to work… this has caused job delays and cost overruns for general contractors." – Kristen Swearingen, VP of Government Affairs, Associated Builders and Contractors
Those shortages are also slowing housing delivery on a national scale. The U.S. needs 3 to 4 million more homes to close the housing gap, yet residential groundbreakings fell 0.6% in 2025 as labor shortages got worse. At the same time, construction job openings dropped 38% year over year by August 2025, as high costs and labor uncertainty pushed projects to the sidelines.
Summary Table of Major Studies
The studies rely on different datasets, but they land in roughly the same place: tighter labor supply leads to fewer workers, harder hiring, and slower building.
| Study / Source | Year | Data Source | Policy Shock | Construction Outcome Measured | Key Finding |
|---|---|---|---|---|---|
| Brookings (Escobari et al.) | 2026 | Lightcast Payroll Data | 2025 ICE Enforcement Surges | Sector-level employment | Construction jobs fell 2.2% on average; up to 4% in long-term surge cities; 102,000 total sector jobs lost. |
| NBER (Cox & East) | 2026 | Current Population Survey | Localized ICE Raids | Undocumented labor participation | 7.5% drop in construction employment for likely undocumented workers; native job losses followed. |
| AGC Workforce Survey | 2025 | Contractor Survey | Interior Enforcement | Vacancy and hiring difficulty | 92% of contractors struggled to fill positions; 35% directly cited enforcement as a factor. |
| Harvard Joint Center for Housing Studies | 2026 | American Community Survey | Immigrant workforce share | Trade-specific labor supply | Immigrants make up 26.3% of the total workforce and up to 61% in critical homebuilding trades. |
Policy Implications, Workforce Deployment, and Conclusion
Policy Changes Studies Most Often Support
Given those findings, the studies point to a fairly narrow set of policy fixes. Most often, they support a cap-counting fix for EB-3 "Other Workers", so dependents no longer reduce worker slots. Industry groups also back visas that scale with current labor demand instead of fixed annual caps. The Dignity Act also funds faster processing at DOL, USCIS, and the State Department.
How Workforce Technology Can Reduce Labor Bottlenecks
Until policy changes take effect, the fastest gains come from better deployment of workers already in the system. Reform tends to move slowly. Contractors still need a better way to match workers to jobs and get them on-site without extra friction.
ABLEMKR matches pre-vetted workers to job sites by certification, safety training, availability, and location. It also tracks payroll and compliance in one system, without repeating compliance steps for every project.
Conclusion: What the Evidence Means for Construction Hiring
Taken together, the studies point to the same policy gap: labor demand is moving faster than the visa system. The evidence points to one clear takeaway: construction needs faster, more flexible legal worker access than current visa channels provide.
Enforcement pressure still cuts into available labor, including among workers with legal status, and that shows up in delays and higher costs. As Ken Simonson, Chief Economist at the Associated General Contractors of America, put it: worker supply has been sharply constrained.
The strongest response is a mix of visa reform, faster processing, and better deployment of available workers.
FAQs
Why is construction especially vulnerable to visa limits?
Construction gets hit hard by visa limits because the industry depends a lot on immigrant labor, including many foreign-born workers. When enforcement ramps up or workers worry about raids, fewer people show up for the job. That shrinks the labor pool, slows projects down, and pushes labor costs up.
Programs like EB-3 are supposed to help employers bring in vetted workers for critical roles. But restrictions and backlogs make that much harder. The result is a less stable workforce, more scheduling pressure, and a higher risk of project delays.
Why don’t H-2B and EB-3 fully meet construction labor needs?
H-2B and EB-3 don’t fully meet construction labor needs.
The main problem with H-2B is simple: the cap is too low. On top of that, the program is limited to seasonal work, which makes year-round hiring hard for construction employers that need a steady labor force.
The EB-3 program has its own set of limits. It’s held back by outdated rules, processing backlogs, and annual caps. And there’s another catch: many of those visas go to dependents, not workers, which further cuts the number of people available for construction jobs.
How do enforcement surges affect project timelines and costs?
A surge in enforcement, including more ICE raids and stricter immigration action, can shrink the construction workforce fast. When workers fear detention or deportation, many stay away from job sites. The result is often labor shortages, slower progress, and project delays.
Those delays can push costs up in a few ways: higher labor rates, more overtime, and bigger subcontractor bids. The uncertainty can also make contractors move more carefully, slow current jobs, or pass on new work. That adds more risk to both schedules and budgets.


