
Clean energy hiring is growing fast in the U.S., and federal policy is a big reason why. I found three clear takeaways from the data: clean energy made up 56% of all new energy jobs in 2023, the sector now supports about 3.46 million workers, and hiring pressure is building in solar, grid, EV, and factory roles.
If you hire, manage crews, or want work in this space, here’s the short version:
- Clean energy added about 142,000 jobs in 2023
- It now makes up about 42% of total U.S. energy employment
- Energy efficiency has the most workers
- Clean vehicles posted the fastest growth at 11%
- Solar, wind, transmission, and manufacturing are driving many new openings
- The IRA and Bipartisan Infrastructure Law are pushing projects from planning into job creation
- Texas, California, the Southeast, and parts of the Midwest stand out as hiring centers
- The main issue is simple: there are not enough skilled trades workers to fill demand
This data also shows a split that matters: some jobs come from short-term construction waves, while others come from factory and site jobs that last for years. So if you’re planning hires, the biggest thing is not just where jobs are growing, but what kind of work each project creates.
That’s the core picture this roundup gives: where jobs are being added, what federal programs are pushing the growth, which states are seeing the most activity, and which roles are getting tight first.
Renewable Energy Jobs: The 2026 Job Search Strategy That Works | SolarPunkPro Podcast Ep. 52
sbb-itb-aa28329
Key National Job Numbers From Recent Reports
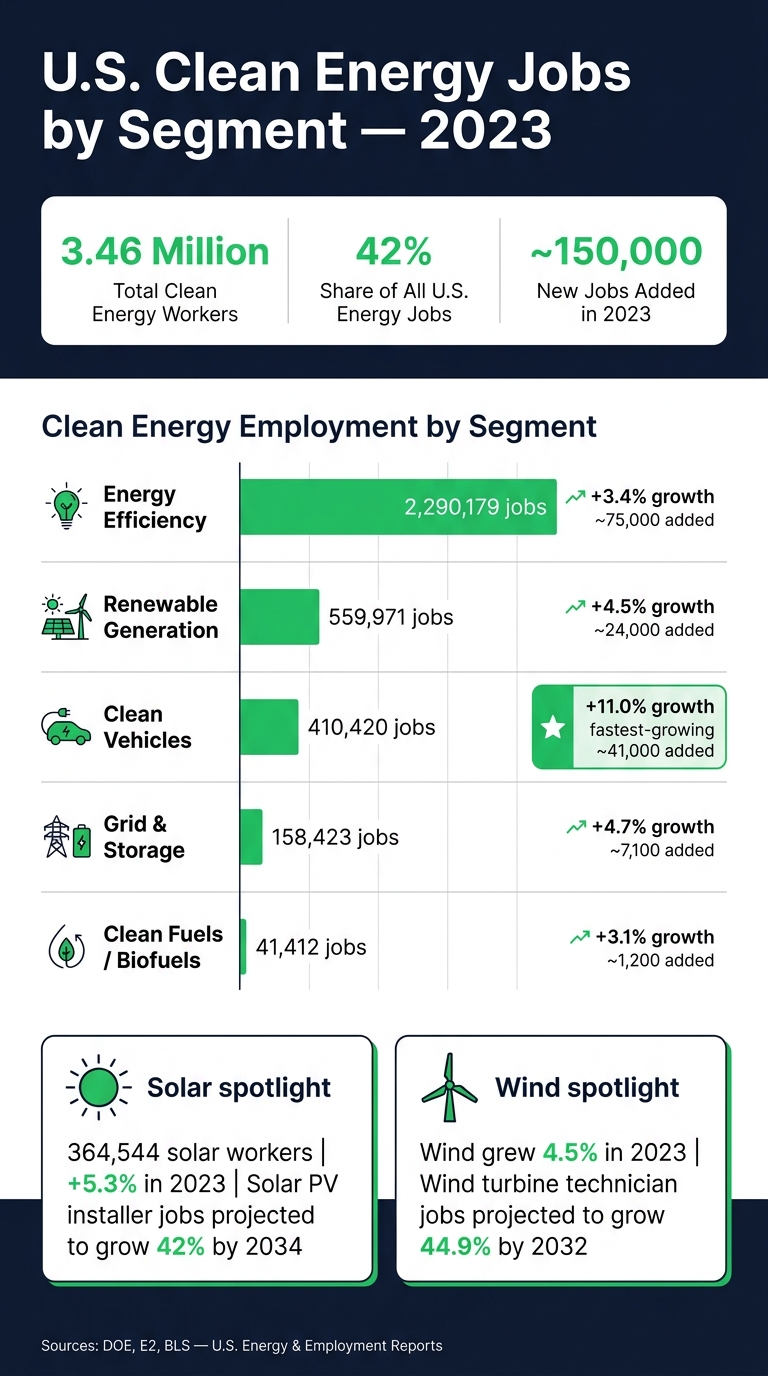
U.S. Clean Energy Jobs by Segment: 2023 Data Snapshot
Top-Line Employment Figures From DOE, E2, and BLS
U.S. clean energy employment reached about 3.46 million workers in 2023. That equals 42% of an estimated 8.35 million total energy jobs. The sector added nearly 150,000 jobs that year, a 4.5% increase. But that headline number only tells part of the story. The hiring picture changes a lot depending on the segment.
It also helps to know that these numbers come from different labor datasets. USEER and E2 look at broad clean-energy employment, while BLS tracks specific occupations. So they’re not measuring the exact same thing. Solar is a good example: solar employment includes installation, manufacturing, sales, and project development – not just rooftop installers.
One big signal stands out from the macro view: DOE estimates that nearly 5% of all new U.S. jobs created in 2023 were in clean energy.
Jobs, Growth Rate, and Annual Additions by Segment
That split matters if you’re thinking about hiring, sourcing, or where labor demand is building.
Energy efficiency is still the largest employer in clean energy by a wide margin, with more than 2.29 million jobs on its own. Renewable generation and clean vehicles are smaller by total headcount, but both are growing at a strong clip. Clean vehicles stood out most in 2023, posting 11% growth – the fastest rate of any segment.
| Segment | 2023 Jobs | Annual Growth | Jobs Added | Source |
|---|---|---|---|---|
| Energy Efficiency | 2,290,179 | +3.4% | ~75,000 | E2 / DOE |
| Renewable Generation | 559,971 | +4.5% | ~24,000 | E2 / DOE |
| Clean Vehicles | 410,420 | +11.0% | ~41,000 | E2 / DOE |
| Grid & Storage | 158,423 | +4.7% | ~7,100 | E2 / DOE |
| Clean Fuels / Biofuels | 41,412 | +3.1% | ~1,200 | E2 / DOE |
Inside renewable generation, solar leads on headcount with 364,544 workers. It added 18,401 jobs in 2023 alone, up 5.3%. Wind grew 4.5% over the same period. Looking ahead, BLS projects that solar photovoltaic installers will grow 42.1% from 2024 to 2034, while wind turbine service technicians are projected to grow 44.9% from 2022 to 2032. Those are among the fastest-growing occupations in the United States, even if both roles still start from smaller bases.
For staffing teams, the pattern is pretty clear. Energy efficiency drives the most volume. Clean vehicles show the fastest growth. And solar and grid work tend to create project-based hiring spikes. Each segment pulls from a different labor pool, which matters when you’re deciding where to source talent and which certifications to put first.
How Federal Programs Are Driving New Hiring
Tax Credits, Manufacturing Incentives, and Grid Funding
Federal programs are pushing projects out of planning and into construction. The Inflation Reduction Act (IRA) is the main force here. It offers long-term tax credits for clean electricity, clean vehicles, advanced manufacturing, and industrial decarbonization. That gives developers and manufacturers the confidence to commit to projects that take years to build and ramp.
Since the IRA passed, companies have announced at least 334 major clean-energy and clean-vehicle projects. Those projects are expected to create 109,278 jobs and draw $125.961 billion in private investment. Another count from Climate Power puts the total much higher: more than 400,000 clean-energy jobs and over $422 billion in announced investments across 48 states and Puerto Rico since the law took effect.
The Bipartisan Infrastructure Law (BIL) is doing similar work on the grid side. DOE’s Transmission Facilitation Program, funded through the BIL, backed $1.5 billion across four transmission projects. Those projects support nearly 1,000 miles of new transmission lines, 7,100 MW of new capacity, and nearly 9,000 jobs.
These programs don’t all hire the same way. IRA clean-electricity credits tend to create a burst of construction demand first: electricians, civil crews, and commissioning teams during a 1–3 year build window. After that, the site usually shifts to a smaller operations and maintenance crew that stays in place over a 20+ year asset life. Manufacturing incentives look different. They tend to lead to plant jobs that continue long after construction crews leave.
A good example is the IRA’s 48C Advanced Energy Project Credit. It was expanded to $10 billion, with $4 billion set aside for energy communities. In DOE’s first allocation round, 35 projects across 20 states received a total of $1.93 billion in credits. Put all of that together, and you get the hiring clusters now showing up at the state level: construction, manufacturing, and grid work happening at the same time.
Program Levers and Their Primary Job Impact
There’s one thing to keep straight: announced jobs and modeled jobs are not the same. Announced figures usually mean direct hires named by project sponsors. Modeled totals try to estimate the full spillover effect, including subcontractors, suppliers, and local service work.
For IRA-era projects, one analysis estimated 621,000 total direct and indirect jobs from 338 projects, compared with at least 110,000 directly announced jobs. So if you’re sizing core on-site hiring, announced numbers are the better guide. If you’re trying to gauge subcontracting and supply-chain demand, modeled totals give a better read.
| Program Lever | Primary Job Types | Hiring Pattern | Source |
|---|---|---|---|
| IRA clean-electricity tax credits | Construction crews, electricians, installers, commissioning teams | 1–3 year build surge, then smaller O&M team | E2, DOE |
| 48C Advanced Energy Project Credit | Fabrication, production workers, plant engineers, industrial maintenance | Multi-decade plant operations; permanent manufacturing jobs | DOE |
| BIL Transmission Facilitation Program | Lineworkers, HV technicians, civil crews, power system engineers | Project-based construction plus ongoing maintenance | DOE |
| IRA EV and battery manufacturing credits | Production line operators, quality technicians, logistics, supply-chain roles | Long-term plant hiring; upstream supplier jobs | E2, DOE |
| BIL EV charging corridor funding | Electrical contractors, field service technicians, network operations staff | Phased rollout across states; ongoing maintenance demand | DOE |
The Clean Investment Monitor makes this easier to read by separating construction jobs from operating jobs tied to specific facilities. That matters because staffing for a two-year build is one thing; staffing a plant or energy site for the long haul is another.
Since the IRA, 2,369 new facilities have opened, backed by $321 billion in investment. Those facilities are already creating ongoing operations work in Texas with nearly 13,000 jobs, Georgia with more than 12,500 jobs, and North Carolina and Michigan with more than 7,500 jobs each. The heaviest concentration is landing in a handful of states, which sets up the next section.
Regional Hot Spots Staffing Teams Should Watch
State and Regional Clusters in Solar, Wind, Storage, and Manufacturing
Renewable investment is bunching up in a handful of states and corridors. That matters for staffing teams because these are the places where project pipelines are starting to turn into near-term hiring demand.
California and Texas sit at the center of the U.S. clean energy labor market. California leads with 552,987 clean energy workers overall, almost double Texas. Texas, meanwhile, is pulling in solar manufacturing, utility-scale solar-plus-storage builds, and grid work. Mission Solar‘s $265 million facility in San Antonio is projected to support 500 long-term manufacturing jobs.
The Southeast is the other big cluster to track. Climate Power’s April 2025 tracking found South Carolina with 15 projects and 6,148 announced jobs and North Carolina with 11 projects and 9,499 jobs. First Solar‘s South Carolina expansion by itself was forecast to create more than 600 jobs tied to a roughly $330 million facility investment.
The table below shows where demand is piling up and which technologies are behind it.
In the Plains and Midwest, wind and transmission lead the way. States like Iowa, Kansas, and Oklahoma have high concentrations of wind generation employment, and multi-year construction timelines keep labor demand in place for longer stretches. Ohio and Michigan add plant-scale manufacturing hiring on top of wind-related work.
Region, Technology Mix, Job Signals, and Project Stage
| Region / State | Leading Technologies | Job Signal | Project Stage |
|---|---|---|---|
| California | Solar, storage, grid modernization | 26,231 renewable generation jobs | Largely operating; ongoing new construction |
| Texas | Utility-scale solar, solar manufacturing, storage | 7,255 new jobs in April 2025 pipeline tracking | Announced, under construction |
| South Carolina | Solar manufacturing | 15 projects; 6,148 announced jobs; First Solar forecast for more than 600 jobs | Announced |
| North Carolina | Clean energy manufacturing, solar | 11 projects; 9,499 jobs | Announced |
| Georgia | Solar manufacturing, components | Multiple IRA-era projects; emerging Southeast manufacturing hub | Announced |
| Plains / Midwest (IA, KS, OK) | Utility-scale wind, transmission | High wind employment base; multi-year construction activity | Under construction, operating |
| Ohio / Michigan | EV and battery manufacturing, wind supply chain | Large announced job counts; multiple plant-scale investments | Announced, under construction |
Climate Power’s January 2025 report also flagged 131 projects in rural communities across 33 states, generating more than 62,117 jobs and $55.25 billion in investment. In plain terms, some of the busiest hiring markets aren’t in major metros at all. Staffing teams that can move into non-metro and rural areas – where local labor pools are smaller – may have an edge.
Those regional patterns point straight to the roles, certifications, and bottlenecks covered next.
Workforce Takeaways and Conclusion
Roles, Skills, and Bottlenecks Emerging From the Data
The regional hot spots all point to the same issue: labor is getting tight.
Demand is strongest for solar PV installers, wind turbine technicians, electricians, lineworkers, heavy equipment operators, and assemblers/fabricators. And the hiring outlook is steep. BLS projects solar PV installer employment to grow about 42% to 48% and wind turbine technician employment about 50% through 2034.
The biggest pinch point is certified, experienced trades. The U.S. may need as many as 1 million more electricians over the next decade. On top of that, a combined IRA/BIL/CHIPS analysis points to a possible shortage of about 1.1 million workers across roughly 20 occupations, led by construction laborers, operating engineers, lineworkers, and assemblers.
Interconnection delays make this even tougher. The U.S. queue is now six times longer than it was in 2014, and it holds more capacity than current U.S. generation. That creates a stop-and-go hiring problem. Once approvals come through, developers may need full crews within weeks. So staffing teams can’t wait until the project is greenlit. They need talent pipelines in place before those milestones land.
Where ABLEMKR Fits in Renewable Workforce Deployment

This gap turns crew deployment into a staffing problem that can’t be handled at the last minute. Renewable and grid projects run on tight timelines, and compliance rules don’t leave much room for mistakes.
ABLEMKR helps by matching pre-vetted labor based on certification, safety training, availability, and location. Its compliance tracking and payroll workflows also help teams move people onto jobs faster and get them paid without delay.
Final Takeaways From the Data
Here’s the plain takeaway: demand is climbing faster than labor supply can keep up.
The staffing teams that stay ahead of project pipelines by region – and line up electricians, lineworkers, and other long-lead trades early – will be in a much better spot.
FAQs
Which clean energy jobs are likely to last the longest?
Jobs that call for specialized technical expertise are likely to stay the most stable over time. That includes wind turbine technicians, solar photovoltaic installers, battery storage specialists, high-voltage electricians, and substation technicians.
These are the people who keep the grid running day to day. They handle maintenance, support grid upgrades, and help modernize aging systems as more renewable power comes online.
Project management roles are also showing steady long-term demand as the renewable sector continues to grow.
Why are some states seeing more renewable hiring than others?
Some states are hiring more in renewables for a simple reason: clean-energy money and project pipelines tend to pile up where the resource base and grid infrastructure make new builds workable. When that happens, jobs don’t show up one by one. They cluster.
But project demand is only part of the story. Hiring also depends on whether the local labor pool is ready to go. Shortages in skilled trades, thin training capacity, certification gaps, and federal incentive compliance rules can all slow hiring and push back mobilization.
What skills or certifications matter most for these roles?
The qualifications that matter most are safety training and role-specific certifications.
For many field roles, OSHA 10- or 30-hour training is the standard starting point. In a lot of cases, employers care more about current, verified credentials than a college degree. That makes sense. If someone is working on a jobsite, around live systems, or at height, proof of training carries a lot of weight.
Common examples include:
- NABCEP for solar and storage
- GWO for wind
- CEM or CEA for energy management
- LEED AP for sustainable building
- PE licenses for grid-related technical roles
The short version: if the role is hands-on or technical, employers usually want to see training that matches the work, not just general education.


