
Fatigue is a major jobsite risk, not just a comfort issue. In the studies I reviewed, it was tied to about 80% of construction incidents, weaker hazard recognition, slower reaction time, burnout, poor sleep, and an estimated $136 billion a year in lost productivity.
If you want the short version, here it is:
- The main causes stay the same: long shifts, overtime, night or swing schedules, sleep loss, heavy work, heat, and poor recovery time.
- Construction and energy jobs show similar patterns: performance drops as shifts and rotations stack up.
- Worker self-reports are not enough: people may not say they feel sleepy even when tests show slower attention and reaction time.
- The best checks use both self-reports and objective tools: such as PVT, wearables, sleep tracking, and short in-the-moment prompts.
- The best employer steps are simple: cut back long runs of 12-hour shifts, limit swing shifts when possible, and screen sleep-apnea risk in workers with chronic disease.
A few numbers stand out:
- Fatigue explained 37% of the variation in hazard recognition and 28% in risk perception.
- In one oilfield study, 52.75% of workers had burnout.
- In one construction feasibility study, hourly smartwatch fatigue check-ins had 77.36% compliance.
- Offshore workers showed worse PVT results across a 28-day hitch even when total sleep time stayed fairly steady.
Here’s the bottom line: fatigue builds from schedule strain, work strain, and poor recovery. And if you only ask workers how tired they feel, you can miss part of the problem.
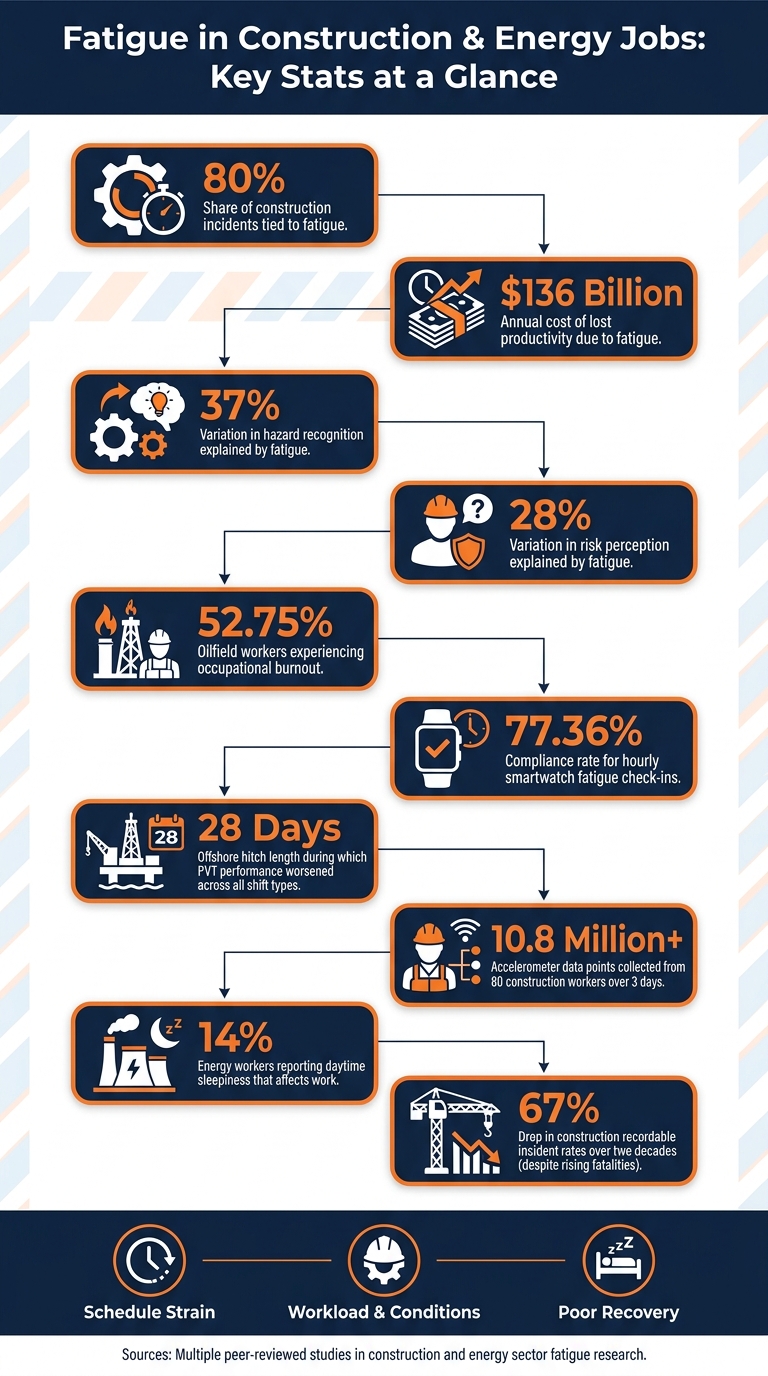
Fatigue in Construction & Energy Jobs: Key Stats at a Glance
Study Scope and Key Findings
Fatigue Patterns in Construction
Construction fatigue comes from hard physical work and changing schedules, and it doesn’t hit every crew the same way. Electricians and general laborers show different fatigue patterns, so findings from one trade don’t map neatly onto another.
Energy work shows much of the same risk. The difference is that longer hitches make the drop in performance easier to see over time.
Fatigue Patterns in the Energy Sector
Workers on offshore rigs often work 12-hour shifts during 28-day rotations. Across those hitches, PVT performance gets worse on day, night, and swing shifts.
Swing shifts appear to be the toughest. They throw off circadian rhythm and lead to more mental fatigue than fixed night shifts. Day shifts, on the other hand, show the biggest increase in physical fatigue.
That matters because extended hitches and sleep-related risk factors have been linked to major safety failures in energy work.
Where the Evidence Is Most Consistent
Across the studies, two patterns show up again and again.
- Objective performance drops over time, even when workers don’t say they feel sleepier. That makes self-reporting alone a weak safety measure.
- Burnout and poor sleep quality are closely linked. In a study of 1,617 oilfield workers, 52.75% experienced occupational burnout, and anxiety explained 33.08% of the link between burnout and poor sleep quality.
Burnout and anxiety are closely tied to poorer sleep quality among oilfield workers. There’s another layer here too: workers with chronic disease face higher sleep-apnea risk, and 14% of energy workers report daytime sleepiness that affects work.
sbb-itb-aa28329
On the Safe Side podcast Episode 62: Fatigue in construction
How Fatigue Was Measured
Those trends only make sense once the measurement method is clear. How researchers measure fatigue shapes what they find.
Self-Reported Fatigue and Sleep Measures
A lot of studies asked workers to describe how they felt. Common tools included the Swedish Occupational Fatigue Inventory (SOFI), the Karolinska Sleepiness Scale (KSS), and Ecological Momentary Assessment (EMA) apps delivered through a smartphone or smartwatch. These tools track perceived exhaustion and sleepiness.
The big drawback is recall bias. A post-shift questionnaire can lean too heavily on how someone feels at that moment and miss fatigue that showed up earlier in the day. EMA helps with that problem because it prompts workers in real time, not hours later.
"EMA is advantageous in that it decreases the subject’s recall bias and can also evaluate temporary associations among several variables simultaneously." – BMC Public Health
That point showed up clearly in a feasibility study of 80 construction workers. Hourly smartwatch prompts worked better than a longer symptom checklist, and the study reported a 77.36% compliance rate for the hourly subjective fatigue reports.
Self-reports tell us how tired workers feel. The next question is whether job performance shows the same pattern.
Objective Performance and Monitoring Tools
Objective methods look at performance or physiology directly. In this research, the main options were performance tests and wearables.
One of the most important tests was the Psychomotor Vigilance Task (PVT). It measures reaction time and attention, both of which drop with sleep loss, even when workers do not report feeling tired. In a 2023–2024 Gulf of Mexico drillship study of 70 offshore workers, PVT scores got worse across all shift types over a 28-day hitch, even though total sleep time stayed fairly stable.
Wearables add a steady stream of field data. Devices such as actigraphy tools, accelerometers, and heart rate monitors can track workers without stopping the job. In the same 80-worker construction study, Samsung Galaxy Watch Active 2 devices collected more than 10.8 million accelerometer data points over three days. Accelerometer and gyroscope capture reached 86.55%, while heart rate capture was lower at 76.58% because of skin-contact issues.
"Performance-based measures (e.g., those obtained from device-based PVT) may be objective in nature but require considerable time to complete the tasks." – Applied Ergonomics
Put simply, both construction and offshore energy show that field measurement can work in active job settings. But the quality of the evidence still depends on how long workers are tracked and how often data is collected.
Study Designs and Evidence Strength
The studies used cross-sectional, longitudinal, and feasibility designs. Cross-sectional surveys give a snapshot at one point in time. Longitudinal field studies are stronger because they follow the same workers across a full rotation and show how fatigue builds day by day. The Gulf of Mexico drillship study is a good example of that approach.
Feasibility studies do something different. They test whether a monitoring system can actually function on a live job site without getting in the way of the work. The construction site project fit that role.
The strongest evidence came from studies that combined self-reports with sensor data. When workers say they are tired and the device data shows slower reactions, lower alertness, or weaker sleep patterns, the findings carry more weight. That gap matters when looking at what drives fatigue in the next section.
Main Drivers of Fatigue
The studies point to three main drivers of fatigue: schedules, workload and site conditions, and barriers to recovery. Together, these help explain why fatigue shows up in both self-reports and measured performance data.
Schedule-Related Drivers
Schedules are a major source of fatigue in both sectors. In construction, the strain often comes from overtime and long weekly hours. In energy, the setup is more fixed: 12-hour shifts that can run for up to 28 straight days, often with little time to recover between work periods.
Rotating swing shifts make things harder. Workers move back and forth between days and nights, which throws off sleep and keeps fatigue high across the full hitch.
Still, schedules aren’t the whole story. The work itself, plus the conditions on-site, also shape how tired people get.
Workload and Environmental Drivers
Construction fatigue tends to be more physical. Energy fatigue leans more toward mental strain and sustained alertness. In both cases, long shifts and poor recovery wear workers down.
That matters because fatigue doesn’t just stop when a shift ends. Once the physical strain or vigilance load is over, recovery conditions shape how much fatigue carries into the next shift.
Travel, Housing, and Recovery Barriers
Energy workers often arrive at remote sites already tired from long travel. Recovery on-site can also be limited by camp-style lodging and constant rig noise. That helps explain why fatigue can climb even when total sleep time looks fine on paper.
Construction workers deal with a different version of the same issue. Daily commutes eat into rest time, and the physical demands of the job mean workers may need more recovery in the first place. The research says this plainly:
"Among all aspects of fatigue, intershift recovery and acute fatigue have the most profound impacts on the safety performance of workers." – Journal of Construction Engineering and Management
Multi-week rotations add another layer of strain. So the problem isn’t just shift length. Site-specific barriers to recovery are a big part of why fatigue builds over time.
Effects, Controls, and Research Gaps
Safety, Health, and Productivity Effects
Fatigue doesn’t just make people feel worn down. It also hits safety, reaction time, and day-to-day output.
When workers are tired, reaction time slows. Vigilance drops. Judgment gets weaker. On job sites, that mix can turn a small mistake into a deadly one. Long shifts, night work, and poor recovery all feed into slower reactions and worse decisions. In some cases, the drop in performance looks similar to moderate alcohol intoxication.
The data points in the same direction. In construction, recordable incident rates fell 67% over the last two decades, yet fatalities went up at the same time, with fatigue listed as a leading human-factor cause. In energy, major disasters such as the BP Texas City Refinery explosion and the Macondo Well blowout have also been tied to sleep deprivation and extended shift rotations.
Evidence-Based Controls for Employers and Crews
The research shows a simple problem: what workers say about their fatigue and what devices pick up don’t always line up. That means a single check isn’t enough.
The best-supported approach combines schedule limits with objective screening. The strongest evidence backs a few steps:
- Limit consecutive 12-hour shifts
- Reduce swing-shift exposure when possible
- Use brief self-reports along with PVT for objective fatigue checks
- Screen workers with chronic disease for sleep apnea, since it directly worsens daytime fatigue
That mix gives crews and employers a better shot at spotting fatigue before it turns into a bad call, a near miss, or worse.
What the Studies Still Do Not Answer
The big unanswered issue isn’t whether fatigue matters. It’s how well current tools measure it across actual jobs and over longer periods.
A lot of studies use small samples tied to one sector. On top of that, self-reports and device data often conflict, which makes it hard to tell which signal deserves more weight. Fatigue prediction models for construction also have only low to medium predictive power, which suggests that many field conditions that shape fatigue still aren’t well understood.
There’s another problem too: most studies look at fatigue during one hitch or one project phase. They don’t track what happens over months or years of exposure. So the long-view picture is still missing pieces.
FAQs
Why doesn’t self-reported tiredness tell the full story?
Self-reported fatigue tells you only part of the story. It’s subjective, so it doesn’t always match a worker’s actual physical exhaustion.
There’s another issue too: these reports rely on people remembering how they felt over the past few days or even months. That can lead to recall bias. And because perceived fatigue can trail behind a worker’s actual state, self-reports on their own may miss real-time safety risks.
Which workers face the highest fatigue risk?
In construction and energy, fatigue hits hardest among workers doing heavy physical work, long or irregular shifts, and jobs in tough conditions.
In construction, laborers and masons often report more fatigue than other roles. In oil and gas, the risk is especially high for crews on remote, multi-week deployments. The mix of complex operations, social isolation, and rotating shifts can throw off circadian rhythms and wear people down fast.
What’s the fastest way employers can reduce fatigue?
The fastest way to cut worker fatigue is to follow a clear order of action: start by removing whatever is causing the fatigue. If that can’t be done, move to substitution, then engineering controls, administrative controls, and finally personal assistive equipment.
ABLEMKR’s real-time data can also help companies manage staffing and compliance day to day. It helps match workers to jobsite demands, which can lower fatigue-related risk before it starts to hurt safety or project performance.


