
Labor can take up 20%–40% of a construction budget, and in self-performed or specialty work it can hit 50%–60%. That means the big question is not just how much labor costs, but when those costs hit your job.
If I had to sum up the article in one line, it would be this: map labor by phase, week, role, and rate before work starts, then check it every week against actual hours. That is how I can see payroll pressure early, plan staffing with fewer surprises, and avoid cash gaps during heavy field production.
Here’s the full idea in plain English:
- Split the job into four stages: pre-build, mobilization, peak work, and closeout
- Match the schedule and WBS to those stages so each activity sits in one phase only
- Tie labor codes and budget lines to the same phase structure
- Assign roles, burdened rates, and planned hours for each phase
- Turn hours into weekly cost with a simple formula: hours × rate
- Convert hours into FTEs by dividing weekly hours by 40
- Build a weekly forecast and roll it into a 13-week cash view
- Check plan vs. actual every week using timesheets, payroll, and daily reports
- Watch for early labor overruns, because they often show up again later if I do nothing
A few numbers stand out:
- A jump from 400 planned hours to 520 actual hours in mobilization creates a 120-hour variance
- If that variance is priced at $60.00 per hour, that is $7,200.00 over plan
- Labor shortages can push cost overruns from 4.14% to 23.65%
- The same issue can push schedule overruns from 4.49% to 29.17%
What matters most is simple: one schedule, one coding structure, one weekly labor forecast, and one weekly review cycle. That gives me a clean way to line up staffing, payroll timing, and phase-based cost control across the whole project.
The rest of the article walks through that process step by step.
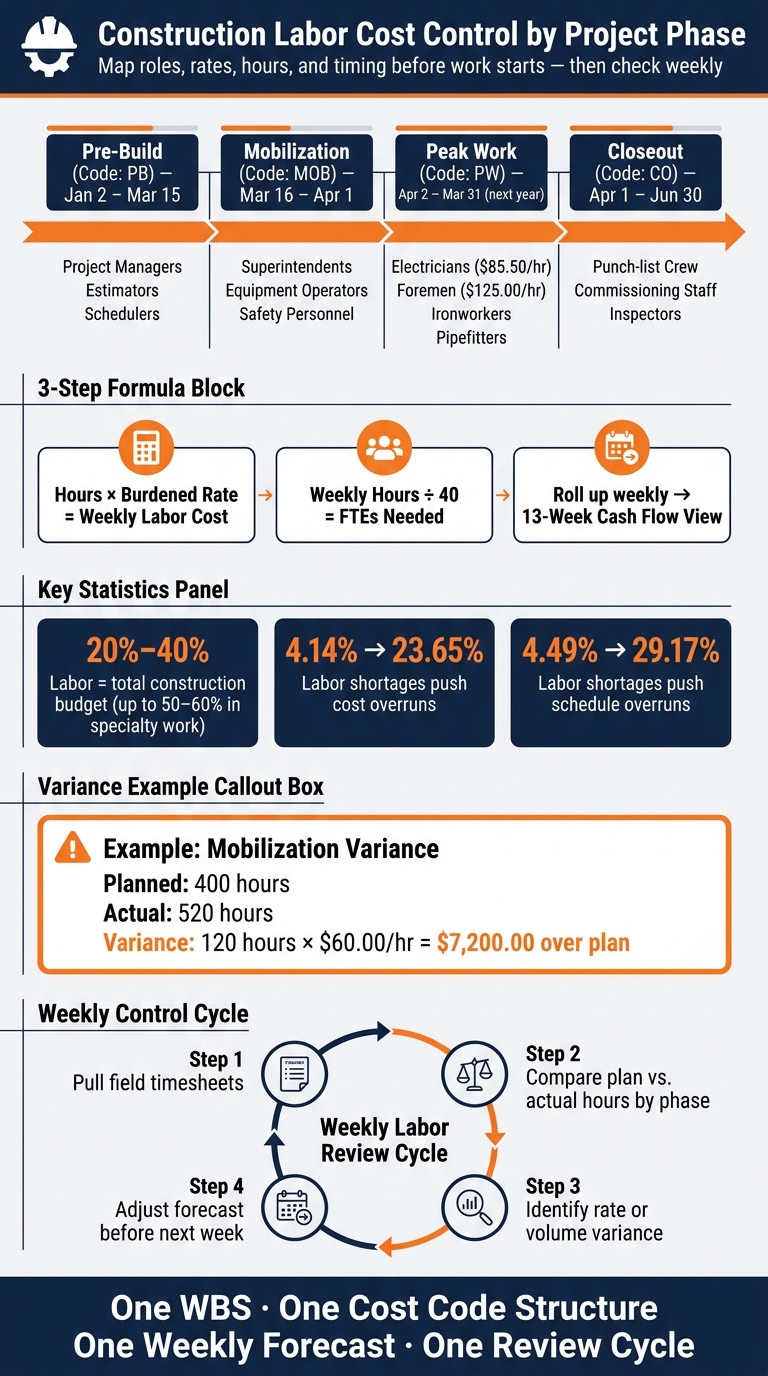
Construction Labor Cost Control: 4-Phase Framework
Xact Masterclass: Forecasting for Construction Projects
Step 1: Build a Schedule and WBS That Align with the Four Project Stages
Start with a WBS that matches the four project stages. At Level 2, tie the structure directly to Pre-Build, Mobilization, Peak Work, and Closeout. Then make sure every work package and activity under that level carries one phase code. That way, labor dollars land in the right stage from the start instead of being sorted out later.
Tag Each Activity by Phase and Date Range
Keep the structure simple: Project → Phase → Work Package → Activity.
Each activity should get exactly one phase code when it’s created. Here’s what that can look like in the schedule:
| Phase | Code | Date Range | Example Work Package | Example Activity |
|---|---|---|---|---|
| Pre-Build | PB | 01/02/2027–03/15/2027 | PB-PROC: Early Procurement | Release long-lead switchgear |
| Mobilization | MOB | 03/16/2027–04/01/2027 | MOB-SITE: Site Setup | Install site fencing, set up trailers |
| Peak Work | PW | 04/02/2027–03/31/2028 | PW-MEP: MEP Rough-In | Run branch circuits, install duct mains |
| Closeout | CO | 04/01/2028–06/30/2028 | CO-PUNCH: Punch List | Correct deficiencies, final clean |
If an activity runs across a phase boundary, split it into two activities. It’s a small step that saves a lot of cleanup later. For example, "Procure equipment (PB)" and "Receive and stage equipment (MOB)" should be separate so each one carries its own phase code, date range, and cost code.
That setup lets labor hours roll up by phase automatically. No manual rework. No messy recoding at the end of the week.
Set Up Budget Lines That Match Scheduled Work
Your cost system should mirror the WBS. In plain English: if the schedule says a task belongs to a phase and work package, the budget line should say the same thing.
Each budget line should use the same:
- Phase ID
- Work Package ID
- Labor cost code
Do that, and you can forecast weekly labor cost by phase with far less guesswork.
Use the same labor cost codes across both systems, such as 3010 (Electrical Labor). Then load labor rates to those same phase-coded lines. For example, foreman labor at $125.00/hour and journeyman electrician labor at $85.50/hour can sit under the same coded phase structure.
That makes phase-level labor forecasts much easier to read. You can see, for instance, that $1.2 million of electrical labor is forecast for peak work rough-in, while $150,000 is tied to mobilization site setup.
Once the schedule and budget lines line up, you can start assigning roles, hours, and timing to each phase.
Step 2: Assign Roles, Rates, Hours, and Timing to Each Stage
Turn each phase into a crew plan with rates, hours, and timing. At this point, each phase code stops being just a label and starts looking like a weekly labor load you can price and track.
Labor Setup for Pre-Build and Mobilization
Pre-build usually runs on a lean planning team. That team often includes project managers, estimators, engineers, schedulers, permitting specialists, and procurement staff.
Give each role a burdened hourly rate. That means the full labor cost, not just hourly pay. Include base wage, payroll taxes, workers’ comp, benefits, insurance, fringes, and overhead.
Use rate data from internal payroll records, union wage scales, or required prevailing wages, including Davis-Bacon projects. Rates can shift by county or state, even for the same role, so don’t assume one number works everywhere.
Mobilization should stand on its own as a separate labor phase. Field setup usually involves superintendents, site logistics staff, equipment operators, safety personnel, and general laborers. Those roles only run during setup, so they need their own phase-coded cost lines instead of being folded into other work.
Those role-based rates then roll into the weekly forecast used later in Peak Work and Closeout.
Labor Loading for Peak Work and Closeout
Peak work is where labor demand gets heavy. This is the phase where carpenters, electricians, ironworkers, pipefitters, welders, and helpers are all active at the same time, along with foremen and QA/QC support.
Model overtime directly in this phase. Don’t bury it in a rough allowance. Premium pay adds cost fast, and long hours can drag down output, which pushes burdened labor cost even higher.
Closeout is different. Crew size drops, but the labor is still planned work. Punch-list tasks, commissioning, inspections, and demobilization all belong here. Treat closeout as its own labor phase, not as leftover time at the end of the job, because it still needs a clean budget even with fewer people on site.
Convert Labor Hours into Weekly Cost by Phase
Weekly labor cost is the key control point because it shows exactly when payroll pressure lands on the schedule. The math is simple: labor cost = hours × burdened rate. Apply that formula by role each week, then add those role totals across the phase.
You should also convert planned hours into FTEs. Divide weekly hours by 40.
If a phase needs 400 hours in a week, that equals 10 FTEs.
That number matters fast. If the site can only handle 6 FTEs, you’ve got a problem before work even begins. In that case, adjust the crew plan or move the schedule before labor hits the field.
sbb-itb-aa28329
Step 3: Build a Time-Phased Labor Cost Forecast
Once you’ve assigned roles, rates, and hours to each phase, map those labor hours to the weeks or months when the work will happen. Use the weekly hours from Step 2 to place labor into the project calendar. That way, pre-build, mobilization, peak work, and closeout all show up on one timeline.
Build the forecast at the weekly level, then roll it up into a 13-week cash-flow view so teams can see labor cash outflow before it hits.
Build Labor-Loaded Reports for Cash Flow and Staffing
After labor is time-phased, turn that data into staffing and cash-flow views.
Two visual tools make this much easier to use day to day: a staffing histogram and a cumulative spend curve.
The staffing histogram puts time on the horizontal axis and labor hours or headcount on the vertical axis. Each bar shows a project stage across its scheduled weeks. Mobilization starts at a moderate level, peak work reaches the highest point, and closeout tapers off. This view helps superintendents plan shift coverage and supervisory ratios before headcount jumps.
The cumulative spend curve shows labor cost over time, with each segment tied to a project stage. It climbs fast during peak work and levels out during closeout, forming the classic S-curve shape. When you lay this curve over your billing schedule, financial managers can see whether cash collections are keeping up with payroll obligations. If the spend curve climbs faster than planned billings, you’re looking at a cash-flow gap that needs attention early.
Update the Forecast Using Actual Labor Data
Use the weekly views to compare plan vs. actuals and adjust the forecast right away.
In U.S. commercial construction, the standard update cycle is weekly, based on three data sources:
- field timesheets
- payroll records
- daily field reports
Each week, compare actual hours and cost by phase against the plan. If mobilization was planned at 400 hours and finishes at 520, the variance is 120 hours and $7,200.00. Labor cost variance usually falls into two buckets: rate variance – wages came in higher than planned – and volume variance – more hours were worked than expected.
Early overruns have a habit of showing up again in later phases if no one steps in. Catching that problem in week two of mobilization is far less costly than finding it in month four of production.
Where ABLEMKR Fits into Phase-Based Labor Planning
Accurate forecasts depend on accurate staffing. ABLEMKR matches pre-vetted workers to forecasted labor demand by certification, safety training, availability, and location. Real-time worker status, payroll workflows, and compliance tracking help keep phase forecasts lined up with actual staffing during mobilization and peak work.
Conclusion: A Simple Framework for Tracking Labor Cost by Project Stage
Once you’ve time-phased the forecast, the last step is simple, but it takes discipline: update it every week with actuals. Labor cost control starts with timing. Map roles, rates, hours, and dates to each phase – pre-build, mobilization, peak work, and closeout – then keep that forecast current with weekly actuals.
That matters because labor gets paid weekly, or even sooner. On most jobs, it’s one of the most cash-sensitive line items.
Key Takeaways for Project Managers and Workforce Planners
- Use one WBS across scheduling and cost control. When both systems match, you can trace labor to a single phase and work package, with clean roll-up by phase.
- Forecast hours first, then convert to dollars. Starting with hours keeps the focus on productivity and crew capacity. It also makes what-if planning – like adding a second crew during peak work – much easier before you commit.
- Review plan vs. actual weekly by phase. If productivity slips, scope changes, or the crew mix is off, you want to see it early. Fixing that in week two is a lot less painful than finding it in month four of production.
- Staff to the work, not the average headcount. Match staffing to when work fronts are ready and to the kind of work coming next. Labor shortages can push cost overruns from 4.14% to 23.65%, and schedule overruns from 4.49% to 29.17%.
The framework is simple: organize, assign, load, update. When you do that well, each phase has its own labor load, cash demand, and staffing plan.
FAQs
What is a burdened labor rate?
A burdened labor rate, also called a loaded labor rate, is the total hourly cost of an employee, not just their base wage.
It includes payroll taxes, insurance, benefits, paid time off, and overhead. That matters because if you track ONLY raw wages, labor can look cheaper than it is. And that can throw off project budgets and lead to weak financial forecasts.
How do I split work that crosses phases?
Use specific cost codes to track labor time and expenses as work moves through each project phase. As tasks shift, workers can change cost codes right from their mobile devices.
That information flows into real-time dashboards. And when it’s connected to accounting software, it helps assign labor costs to the right phases automatically and with accuracy.
Why use a 13-week labor cash forecast?
A 13-week labor cash forecast gives you a rolling, forward-looking view of workforce costs. That means you can spot profit risks and cash problems before they turn into bigger issues.
For contractors, that matters a lot. Labor demand can shift with the season. Wages can go up. Productivity can drift. Jobs can slow down because of delays or thin staffing. A 13-week forecast helps you react while there’s still time, so crew size, project cash flow, and gross margin stay on track.


