
Labor costs are a major factor in mining and oil & gas projects, often accounting for 40–76.5% of expenses. These industries face unique challenges, including remote locations, talent shortages, and high turnover rates. Here’s what you need to know:
- Oil & Gas: Workers earn higher wages, with average costs per employee reaching $115,400 in 2026. Roles like petroleum engineers command salaries over $169,000 annually. Offshore projects add logistical complexity, driving costs even higher.
- Mining: Labor costs are rising due to talent scarcity, driven by an aging workforce and declining mining programs. Specialized roles like geological engineers average $101,020 per year, with remote operations requiring additional expenses for accommodations and travel.
Quick Comparison
| Metric | Oil & Gas | Mining |
|---|---|---|
| Avg. Cost Per Employee (2026) | $115,400 | Lower, but increasing |
| Top Engineer Salary | $169,280 (Petroleum Engineers) | $102,610 (Geological Engineers) |
| Labor % of OPEX | Up to 76.5% | 40–50% |
| Turnover Rate | 25% (FIFO workers) | Higher due to aging workforce |
| Key Cost Drivers | Offshore logistics, high wages | Remote sites, talent shortages |
Labor costs are volatile, impacted by factors like compliance requirements, project type, and regional wage differences. Tools like ABLEMKR help operators track and manage these costs efficiently.
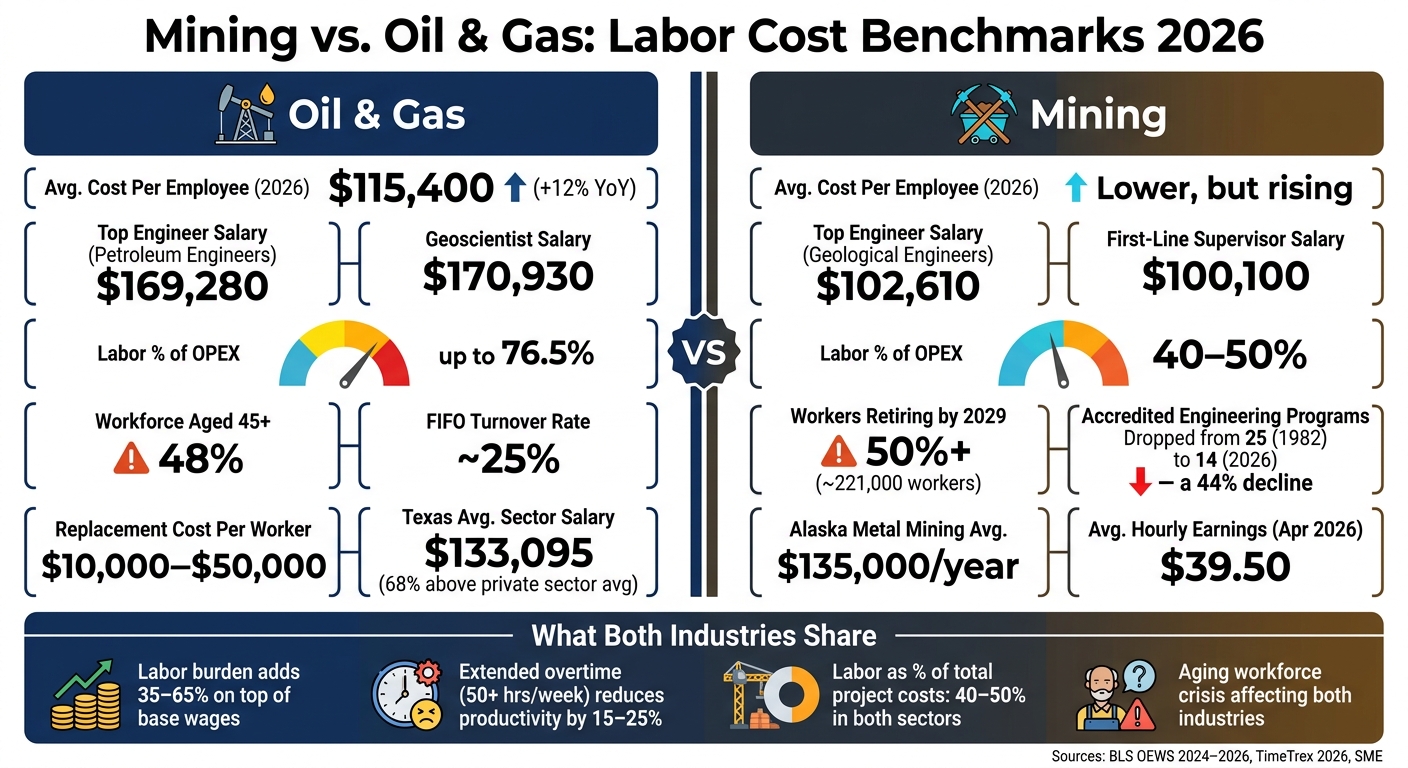
Mining vs. Oil & Gas: Labor Cost Benchmarks 2026
Labor Cost Structures in Mining Projects
Mining projects – whether it’s starting from scratch with greenfield development or managing remote FIFO (fly-in, fly-out) operations – come with their own unique labor cost challenges.
Common Mining Project Types
Mining projects generally fall into four main categories: greenfield mine development, underground construction, processing plant construction, and remote/FIFO operations. Each type has its own labor needs:
- Greenfield projects rely on construction trades, engineers, and environmental specialists to establish a mine from the ground up.
- Underground construction brings added complexity, requiring specialized contractors and stricter safety standards, which drive up costs.
- Processing plant construction shifts the focus to skilled trades like millwrights, electricians, welders, and plant operators.
- Remote operations, especially in states like Alaska, involve logistical challenges such as rotating schedules and camp accommodations, which significantly increase labor expenses.
Understanding these categories helps set realistic expectations for workforce demands and wage ranges.
Core Labor Roles and Wage Ranges
Here’s a breakdown of key roles and their current wage benchmarks in the U.S.:
| Role | Median Hourly Wage | Mean Annual Wage |
|---|---|---|
| First-Line Supervisors (Extraction) | $48.13 | $100,100 |
| Mining & Geological Engineers | – | $101,020 |
| Operating Engineers / Equipment Operators | $28.97 | $60,250 |
| Continuous Mining Machine Operators | $29.93 | $62,240 |
| Heavy & Tractor-Trailer Truck Drivers | $28.01 | $58,250 |
| Excavating & Loading Machine Operators | $27.74 | $57,700 |
Source: BLS, OEWS 2024–2026 data
Regional variations play a big role in wage differences. For example, Western U.S. mines typically pay around 10% more than the national average. Alaska stands out even more, with metal mining jobs averaging $135,000 annually in 2024 – nearly twice the state’s average salary. This reflects the high costs of staffing remote, high-risk sites, where nearly half the workforce consists of non-residents commuting on rotating schedules (e.g., two weeks on, two weeks off).
These wages provide a foundation for understanding what drives labor costs in mining.
What Drives Labor Costs in Mining
Several factors consistently push labor costs higher in the mining sector:
- Remote location costs: FIFO logistics and camp services add significant expenses beyond base wages.
- Mandatory compliance and training: Regulations like MSHA Part 46 (for surface mining) and Part 48 (for underground mining) require extensive training, including new worker orientations, annual refreshers, and task-specific certifications. Managing these requirements across large contractor teams can demand substantial administrative resources.
- Talent scarcity: The number of accredited U.S. mining engineering programs has dropped from 25 in 1982 to just 14 by 2026, creating a bottleneck in the talent pipeline. Automation is also reshaping roles, with traditional equipment operators transitioning to positions like remote operations technicians and autonomous fleet supervisors. Workers with both mining expertise and digital skills are in high demand, driving wages even higher.
"The mining industry is staring down a workforce cliff. By 2029, more than half of the current U.S. mining workforce could retire and be replaced – roughly 221,000 workers cycling out of the labor force." – Society for Mining, Metallurgy & Exploration (SME)
As of April 2026, average hourly earnings in the mining sector (excluding oil and gas) hit $39.50. This tight labor market has made recruitment more expensive and time-consuming, especially for critical roles. It also complicates cross-border staffing and logistics for projects in remote areas.
sbb-itb-aa28329
Labor Cost Structures in Oil & Gas Projects
Oil and gas projects are incredibly diverse, ranging from onshore drilling sites in West Texas to offshore rigs in the Gulf of Mexico. Each type of project comes with its own unique set of costs and challenges.
Common Oil & Gas Project Types
The oil and gas industry is divided into three main segments, each with distinct labor needs:
- Upstream: This involves exploration and drilling. Nearly half (47.4%) of the workforce in this segment is employed in construction and extraction roles.
- Midstream: Focused on pipeline transportation and compression, this segment relies heavily on mechanics and operators to keep the flow of oil and gas uninterrupted.
- Downstream: Concerned with refining and petrochemical processing, this area has a workforce where production roles make up 40.3%.
These segments demand highly specialized skills, which directly influence labor costs. For instance, a refinery turnaround requires a concentrated team of pipefitters, welders, and technicians working under strict deadlines. Such variations in project types result in different wage structures, which are explored next.
Key Labor Roles and Wage Ranges
In oil and gas, wages vary significantly depending on the role. Direct extraction jobs often command higher pay compared to support roles. For example, first-line supervisors in extraction earn about $124,100 annually, while their counterparts in support activities make roughly $87,130.
| Role | Avg. Hourly Wage | Avg. Annual Salary |
|---|---|---|
| Petroleum Engineers (Extraction) | $81.39 | $169,280 |
| Geoscientists | – | $170,930 |
| Wellhead Pumpers (Extraction) | $35.58 | $74,000 |
| Rotary Drill Operators (Extraction) | – | $73,780 |
| Refinery Operators & Gaugers | $41.90 | $87,160 |
| Roustabouts (Extraction) | $23.58 | $49,040 |
Source: BLS, OEWS May 2024; TimeTrex 2026
Texas serves as a benchmark for the industry. The average annual salary in the state’s oil and gas sector is $133,095, which is 68% higher than the average private-sector wage in Texas. These significant wage differences highlight the financial pressures unique to oil and gas operations.
What Drives Labor Costs in Oil & Gas
Labor costs in oil and gas projects are influenced by a mix of regional challenges, operational constraints, and industry-specific factors like offshore logistics and workforce demographics.
By 2026, the average cost per employee in the sector reached $115,400, representing a 12% increase year-over-year. Labor accounted for 76.5% of OPEX in 2024, up from 68.9% in 2021. This rise in labor costs places additional financial strain on projects.
Here are some of the key drivers behind these costs:
- Offshore Operations: These projects involve significant logistical expenses, such as helicopter transport, on-site catering, hazard pay, and housing for workers.
- Onshore Projects: Regional wage inflation and the expense of accommodating out-of-state workers add to the costs, especially in areas with limited local skilled labor.
- Pipeline Construction: Labor makes up 44.3% of total construction costs, averaging $3.45 million per mile in 2024.
Project maturity also plays a role. Mature fields often require more frequent interventions, which can increase production costs by up to $15 per barrel. Similarly, brownfield refinery projects demand 1.35–1.60 times the usual labor hours due to added safety and congestion measures.
"Labor is the most expensive category and the most volatile." – Christopher E. Smith, Editor in Chief, Oil & Gas Journal
An aging workforce further complicates matters. With 48% of oil and gas employees aged 45 or older, the industry is losing experienced workers faster than it can replace them. Replacing a specialized remote worker can cost anywhere between $10,000 and $50,000.
Mining vs. Oil & Gas: A Direct Labor Cost Comparison
Labor Cost Benchmarks by Role and Project Type
When comparing similar roles, the pay gap between the mining and oil and gas industries is striking. For instance, mining and geological engineers in oil and gas extraction earn a median salary of $156,200 per year, while their counterparts in metal ore mining earn $102,610 – a difference of over $53,000 annually. This disparity highlights how the oil and gas industry uses higher wages to address technical skill shortages and attract top talent.
| Metric | Oil & Gas | Mining |
|---|---|---|
| Median Engineer Pay | $156,200 (O&G Extraction) | $102,610 (Metal Ore Mining) |
| Labor Share of Project Costs | 44.3% (Pipeline Construction) | 40–50% (General Mining/Construction) |
| Workforce Aging Risk | 48% of workers aged 45+ | Over 50% retiring by 2029 |
| Overtime Rate | 1.5x base; 2.0x weekends/holidays | Varies by contract and region |
| Avg. Cost Per Employee (2026) | $115,400 | Lower, but increasing due to critical mineral demand |
Although labor costs as a percentage of total project expenses are comparable – generally 40% to 50% – oil and gas projects can see labor costs soar to 76.5% of OPEX in some cases.
Next, let’s look at how specific project types and locations impact these labor cost differences.
How Project Factors Shape Labor Costs
Labor costs are heavily influenced by the unique demands of each project. In oil and gas, remote or offshore projects often require additional expenses for transportation and worker accommodations – challenges that surface mining projects typically avoid. However, mining operations in remote areas, such as the western U.S., face their own hurdles, including limited local labor availability, long commutes, and the need to house out-of-state workers.
Extended overtime – working more than 50 hours a week – can reduce productivity by 15% to 25%, which effectively raises labor costs. On top of this, the labor burden (which includes taxes, insurance, and benefits) adds another 35% to 65% to base wages in both industries, often catching project managers off guard during budgeting.
"An estimator who miscalculates labor rates by even 10% can swing a $2 million project bid by $80,000–$100,000." – Sanjesh G. Reddy
Risk and Cost Volatility
Both industries face labor market challenges, though the causes differ. In oil and gas, dramatic swings in crude prices can have a lasting impact. Past price collapses have driven experienced workers out of the industry, making labor costs unpredictable during recovery periods.
For mining, the primary concern is an aging workforce. Over 50% of U.S. mining workers – roughly 221,000 people – are expected to retire by 2029. At the same time, demand for critical minerals like lithium is projected to grow fivefold by 2040, creating fierce competition for skilled labor. While automation, such as AI systems in oil and gas or robotics in mining, offers some relief, these technologies are not yet a full replacement for skilled workers.
How Technology Supports Labor Cost Benchmarking
Using Workforce Deployment Platforms Like ABLEMKR

Managing labor costs efficiently can be challenging, especially when data arrives too late to make a difference. Workforce deployment platforms like ABLEMKR offer a solution by centralizing and streamlining labor cost tracking. Traditional methods – like reconciling timesheets and processing invoices – often lead to delays, making it hard to stay within budget. ABLEMKR simplifies this process by housing worker profiles, time tracking, pay rates, and project assignments in one platform.
For example, when an operator needs workers for a 30-day refinery turnaround or a new mining project, ABLEMKR quickly matches candidates based on verified certifications (like MSHA Part 46/48 for mining or TWIC and H2S training for oil and gas), location, and availability. Operators typically see qualified applicants within 24–48 hours. The system ties every hour worked to a specific rate card and cost code, removing any guesswork about expenses. Rates are set directly by the operator, not negotiated through third-party intermediaries, giving a real-time snapshot of labor market conditions.
This centralized approach not only speeds up staffing but also ensures more accurate and standardized data collection.
Getting More Accurate Benchmark Data
Accurate benchmarking relies on consistent and standardized data, but many operators face hurdles like inconsistent job titles, varying overtime rules, and manual entry errors. ABLEMKR addresses these issues by standardizing job categories and units – such as hourly rates in USD with clear overtime multipliers and per diem amounts – across all projects. GPS-enabled timecards provide a verifiable audit trail of hours worked, adding another layer of accuracy.
This standardization creates a reliable dataset for analyzing labor hours and costs tied to specific work packages, whether it’s "open-pit stripping", "well completion", or "turnaround maintenance." These insights can then be used to refine bid templates, allowing operators to establish benchmarks like the average labor cost per linear foot of pipeline installed or per ton of ore moved during ramp-up. The transparency also streamlines internal reporting, enabling finance teams to reconcile forecasts with actuals more efficiently. External stakeholders, such as joint-venture partners or lenders, benefit from access to auditable summaries of certified hours, shift premiums, and any downtime due to safety or training requirements.
By starting with standardized data, operators can expand their understanding to include regional and cross-border labor cost variations.
Cross-Border and Regional Staffing Insights
For operators managing projects across various U.S. states or near international borders, regional labor cost differences can be a significant challenge. ABLEMKR’s mobile-first, geo-location features help track where workers are deployed and how long they stay on-site. This data uncovers valuable insights, such as the cost and time differences between mobilizing crews from Houston to West Texas shale plays versus hiring locally. These are details that manual systems often miss.
In remote mining locations like Nevada or Wyoming, ABLEMKR also handles fly-in/fly-out (FIFO) logistics, roster scheduling, and accommodations. It tracks expenses beyond base wages, such as travel, camp, and overtime costs, which often make up a large portion of total labor expenses but are frequently overlooked until they cause budget overruns. By consolidating all this data, operators can create reliable regional benchmarks and make smarter decisions about whether to hire locally or rotate crews from other regions.
With the ability to link regional labor differences to real-time data, operators gain a complete picture of their workforce costs, strengthening their ability to set accurate benchmarks and manage budgets effectively.
Conclusion
The mining and oil & gas sectors face similar challenges when it comes to labor costs, but their struggles diverge in some critical ways. For instance, oil & gas offers much higher wages for top-tier roles, while mining is grappling with an aging workforce and a shortage of new talent. This talent crunch is made worse by a sharp decline – 44% – in accredited engineering programs since 1982. Both industries also deal with hidden costs that traditional benchmarks often miss. In oil & gas, fly-in/fly-out (FIFO) workers experience an annual turnover rate nearing 25%, and replacing just one specialized remote worker can cost anywhere between $10,000 and $50,000. These factors highlight the importance of precise cost benchmarks to guide budgeting.
Technology can be a game-changer in tackling these issues. Understanding the differences in wages between entry-level field workers and senior engineers, alongside factors like FIFO logistics and per diem allowances, helps project managers create more accurate budgets. Without dependable data, cost estimates are prone to errors that can derail projects.
Platforms like ABLEMKR make managing labor costs simpler and more efficient. By standardizing job roles, linking hours to cost codes, and tracking certifications like MSHA Part 46/48 or TWIC from the start, operators can gain better insights and avoid delays caused by manual processes or hidden third-party fees. These tools also make it easier to deploy labor across borders, giving operators a clear view of regional cost differences – whether comparing mobilization expenses across U.S. states or managing rotating crews at remote locations.
"We staffed our entire site expansion project using ABLEMKR. Their platform streamlined everything from finding certified operators to processing weekly payroll for a large crew." – Mine Superintendent
FAQs
What hidden labor costs should I budget for on remote or FIFO projects?
When planning budgets for remote or fly-in/fly-out projects, it’s important to account for more than just wages. Costs like overtime pay – typically 1.5x the standard rate for hours exceeding 40 per week or 8 per day – can add up quickly. Additionally, you’ll need to include per diems to cover meals and lodging, along with travel expenses such as flights and mileage.
Don’t forget about agency markups, which often range between 20% and 50% for recruitment and payroll taxes. You’ll also need to budget for logistics, like housing accommodations and vehicle rentals. To stay prepared for the unexpected, setting aside a contingency buffer of 10%-15% can help you manage unforeseen expenses.
How do certifications and compliance rules impact labor costs across states and borders?
Certifications and compliance rules play a big role in shaping labor costs, mainly because they require specialized training and added administrative work. For example, workers in industries like mining and energy often need specific credentials. In mining, MSHA training is a must, while energy projects often demand certifications like TWIC cards or OSHA 10/30 training. Missing these requirements can cause serious headaches – think project delays, audits, or even fines.
This is where tools like ABLEMKR come into play. They help connect pre-vetted workers with the right job requirements, cutting down on compliance risks and saving businesses from spending unnecessarily.
What’s the fastest way to benchmark labor rates by role and location in real time?
If you’re looking to benchmark labor rates by role and location quickly, a digital workforce platform like ABLEMKR is your go-to solution. It leverages real-time data from mobile apps and GPS tracking, giving you instant visibility into costs.
With ABLEMKR, managers can:
- Track hours and expenses through intuitive dashboards.
- Set hourly budgets to maintain control over costs.
- Adjust workforce allocation dynamically to match project needs.
This approach eliminates the need for manual reporting, ensuring project costs are accurate and manageable right from the start.


