
Labor cost misses usually start with bad time data, old burden rates, and weak jobsite visibility. If you fix those three inputs, you give yourself a much better shot at keeping labor forecast variance under 2% instead of eating errors that can reach 8% to 15%.
Here’s the short version: I’d treat labor forecasting as a live process, not a one-time estimate. That means tying digital time entry, clean cost codes, current burden rates, historical unit rates, and daily forecast reviews into one data flow. On U.S. projects, where labor can make up 60% to 70% of total cost and burden can add 35% to 55% on top of wages, small input errors can turn into large budget gaps fast.
If I had to boil the article down to the main points, they’d be these:
- Labor cost is more than hourly pay. You have to include overtime, taxes, insurance, benefits, union items, and nonproductive time.
- Manual time entry creates drift. Memory-based logs can bring 5% to 10% variance, while live time logging can cut that to under 1%.
- Generic productivity assumptions often miss the field picture. Past unit rates from similar jobs usually give a better starting point.
- Old burden rates distort forecasts. A move from 35% to 45% burden can cut into labor dollars fast.
- Rolling forecasts work better than static budgets. Daily checks on planned vs. actual hours help teams act before overruns spread.
- One connected record matters. Workforce status, payroll, compliance, and project coding should all line up.
A simple example shows why this matters: on a $10,000,000 project with $4,000,000 in labor, an 8% labor tracking error can mean $320,000 in costs you did not plan for.
So if you want better labor cost accuracy, I’d start here:
- Use digital, shift-level time entry.
- Clean up cost code use across crews and jobs.
- Update burden rates with current payroll data.
- Base new forecasts on actual unit-rate history.
- Review labor variance every day and act the same day when gaps get too large.
That’s the core idea of the article: better labor forecasts come from better labor inputs.
Mastering Labor Cost Forecasting in Capital Projects
sbb-itb-aa28329
Why Labor Cost Forecasts Miss the Mark
The biggest forecast misses usually start much earlier than most teams think. They begin in day-to-day workforce work: scheduling, time entry, and crew approvals. By the time bad data lands in payroll or an ERP, the damage is already done, and fixing it costs more.
Manual Time Tracking and Incomplete Cost Data
Manual, memory-based time entry still causes avoidable swings in labor numbers. Retrospective time capture usually comes with a 5% to 10% data variance, while real-time capture cuts that to under 1%. That gap matters. Reports may show the problem, but they don’t cause it.
Cost coding issues add another problem. If hours go to the wrong project, or teams apply codes differently from the original plan, the labor baseline starts to drift. And once the time data is off, later estimates only stack more error on top.
Generic Productivity Assumptions and Disconnected Planning
Another common issue is using generic productivity assumptions. On paper, standard productivity tables can look fine. In the field, they often miss what’s actually happening. Historical unit rates tend to tell a better story, because they reflect how work gets done under normal job conditions.
Fatigue, absenteeism, and turnover can all drag output down and add hidden cost. That means a forecast can look clean in a spreadsheet while the job itself is slipping.
Scheduling choices also hit cost right away, but many teams make those choices without a live tie to the budget. Crew moves and overtime can change project cost in real time, yet those changes often don’t flow back into the forecast. That’s one reason labor budgets often miss by 10% to 15%.
Even when time data is clean, labor costs can still be off if burden and compliance rules haven’t kept up.
Outdated Burden Rates, Compliance Gaps, and Limited Field Visibility
A lot of contractors still use burden rates that are two to three years old. That’s risky. If actual burden moves from 35% to 45%, the result can be about 7% to 8% lost on every labor dollar.
Compliance makes this even harder. Prevailing wage rules, union agreements, fringe calculations, and multi-state labor laws all call for different rates based on classification, location, and worker status. A flat burden percentage doesn’t reflect that. It’s a blunt tool for a job that needs precision.
Then there’s field visibility. Without real-time workforce data, overtime spikes and shift differentials often show up only after the money is already gone.
How Data Analytics Improves Labor Cost Forecast Accuracy
The problems covered so far – bad time data, stale burden rates, disconnected systems – point to the same fix: move away from scattered manual inputs and use a structured, data-driven setup. Analytics doesn’t just help teams spot issues faster. It changes how labor forecasts are built from the ground up.
At the center of that shift is one connected data flow: clean labor inputs, current rates, and live workforce status.
Build a Standardized Labor Data Model
Before analysis can help, the data underneath it has to match from one job to the next. That means using the same cost codes and worker classifications across every job site, crew, and project, no matter the size or location.
When coding is inconsistent, project-to-project comparisons stop being trustworthy. The result is systematic variance that weakens every forecast.
Standardized cost codes make it easier to compare crews, benchmark performance, and spot repeat overruns. A unified data model also cuts out manual re-entry and the mistakes that come with it. When worker ID, timestamp, geo-location, and cost code move straight into payroll and ERP systems through API connections, the data is cleaner and easier to use. Teams can cut payroll reconciliation time sharply.
Once the data is standardized, past job patterns become useful inputs instead of messy records sitting in a system.
Use Historical Trends, Unit Rates, and Predictive Models
With a consistent data model in place, past project records become far more useful. Teams can look at hours per unit, crew mix, overtime patterns, and location-based productivity trends to build a grounded starting point for new estimates.
A sound forecast ties projected hours to verified unit rates from similar work. From there, wages, overtime premiums, and compliance-related costs can be recalculated from actual job data instead of carrying old figures forward. Current-project data also sharpens future bids.
That matters because labor forecasting isn’t guesswork. It’s closer to using a rearview mirror and a live dashboard at the same time: past performance shows the pattern, and current job data shows whether the pattern is still holding.
Run Rolling Forecasts with Real-Time Workforce Visibility
Static forecasts go stale fast. Rolling forecasts keep labor projections current by updating planned versus actual labor hours and dollars as the job moves forward.
The main win here is early action, not just tighter math. Real-time labor data shows trouble sooner, when fixes still cost less.
Leading project teams use a 10% variance threshold between actual and planned headcount to trigger same-day investigations. That’s a big shift from finding the issue days later in a weekly report.
When workforce data updates in real time, teams can adjust forecasts before overruns snowball. Real-time workforce visibility, payroll integration, and verified worker data help keep forecast inputs current.
How to Apply Analytics in Construction and Energy
After you standardize labor data, the next move is simple: use it where hours are actually logged.
Start with Digital Time Capture and Clean Cost Codes
Late time entry is one of the biggest reasons labor data goes sideways in construction and energy. When workers log time at the end of a shift or, worse, at the end of the week, the data gets fuzzy fast. If you want forecasts based on what happened on site, time needs to be captured at the moment it happens and tied to both a cost code and a role at check-in and check-out.
Timing is only half the job. Cost code discipline matters just as much. When crews use the right codes every time they clock in and out, each hour goes into the right bucket. That makes cross-project variance analysis far more dependable.
In March 2026, Prism Electric implemented biometric facial verification at the point of entry to eliminate buddy punching and automate cost code capture. The result was payroll data that project managers could trust for real-time job costing decisions, without manual transcription.
Clean time capture does not do much if payroll and compliance are reading from different records.
Connect Workforce Deployment, Payroll, and Compliance Data
Worker assignments, verified credentials, hours worked, and payroll should live in one record. When those data points are linked, forecast decisions reflect actual crew status, compliance standing, and cost exposure instead of a mix of separate reports.
ABLEMKR ties hiring, onboarding, compliance tracking, and payroll workflows into one platform built for high-demand, high-risk industries like construction, oil & gas, and mining. That gives employers real-time visibility into worker status and assignments, so forecast inputs stay current.
Once that data is tied together, the next step is to review it on a set schedule. Otherwise, teams spot overruns after the damage is already done.
Set Up a Repeatable Forecast Review Process
Use a fixed review cadence. Compare forecasted labor hours with actual labor hours every day, and escalate outliers right away for same-day action. That keeps the team focused on the biggest forecast gaps instead of getting lost in the weeds.
When you find a variance, do not stop at fixing the current job. Feed what you learned back into future estimates. Verified actual hours from completed work help sharpen productivity assumptions during estimating, which leads to more accurate bids over time.
Measuring Results and Closing the Loop
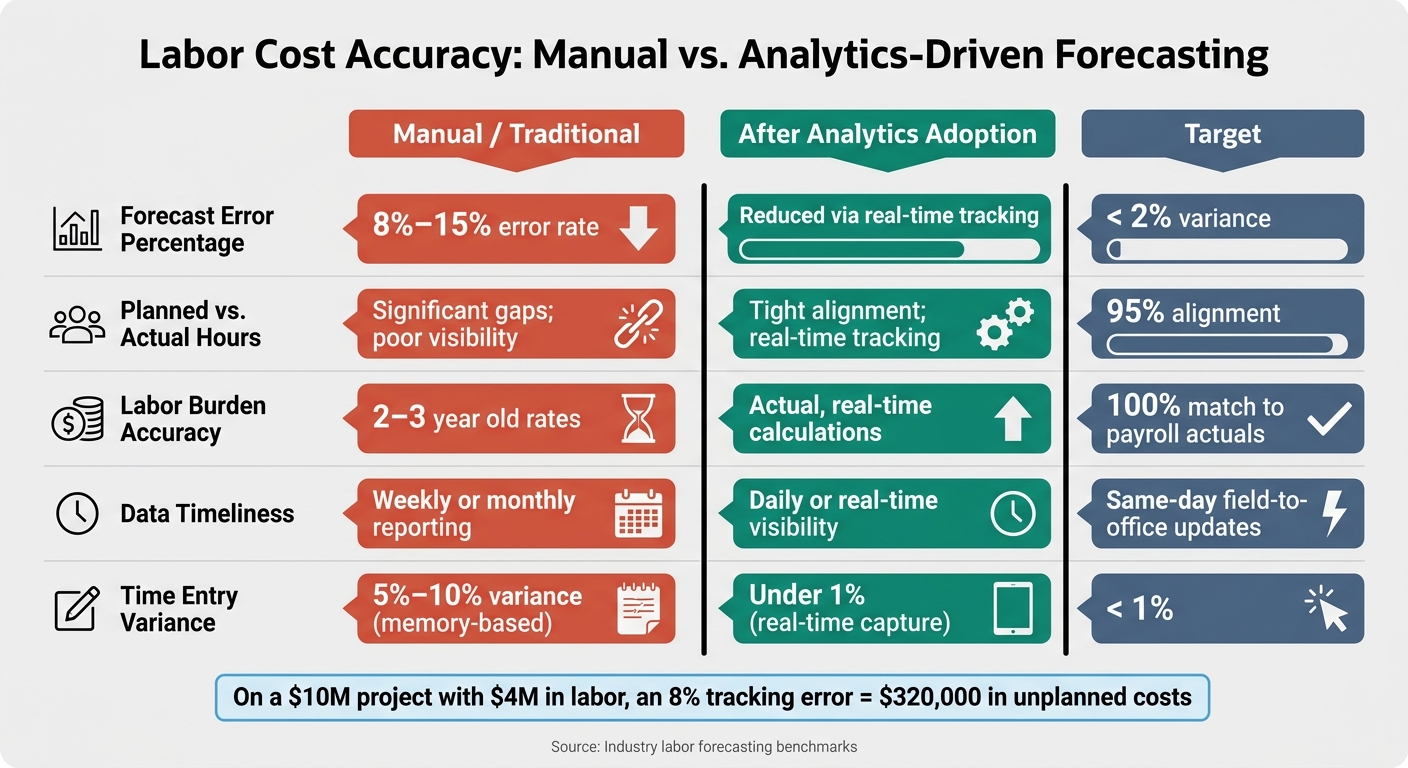
Labor Cost Accuracy: Manual vs. Analytics-Driven Forecasting
Track the Right Accuracy and Performance Metrics
Once the review rhythm is set, the next step is simple: check if it’s making forecasts better.
Track forecast-to-actual variance, labor burden accuracy, and data timeliness during every review cycle. Those three numbers tell you fast whether your process is working or drifting.
Forecast-to-actual variance is the clearest sign of forecasting health. The goal is less than 2% variance between forecasted and actual hours.
Keep a close eye on labor burden accuracy too. Old rates can throw off labor cost when taxes, insurance, and union costs shift.
Here’s what normal improvement can look like across the metrics that matter most:
| Metric | Baseline (Manual/Traditional) | After Analytics Adoption | Target |
|---|---|---|---|
| Forecast Error Percentage | 1%–8% error rate | Reduced variance through real-time tracking | < 2% variance |
| Planned vs. Actual Hours | Significant gaps; poor visibility | Tight alignment; real-time tracking | 95% alignment |
| Labor Burden Accuracy | 2–3 year old rates | Actual, real-time calculations | 100% alignment with payroll actuals |
| Data Timeliness | Weekly or monthly reporting | Daily or real-time visibility | Same-day field-to-office updates |
Data timeliness deserves its own attention. If a cost code starts moving over budget, daily or real-time dashboards can show the issue soon enough to respond. If any metric slips, adjust the forecast before the month closes.
Then send those results back into estimating and crew planning. Completed-project hours should reset future productivity assumptions.
Conclusion: Better Data Produces Better Forecasts
Every problem covered in this article – missed forecasts, stale burden rates, and siloed payroll data – comes back to incomplete or inconsistent workforce data. Close that loop, and labor forecasting turns into a management tool instead of a guess.
FAQs
What labor costs are usually missed in forecasts?
Forecasts often miss costs that sit beyond base wages. That usually happens when data lives in different places or when teams keep using the same old assumptions.
Some of the most common misses are payroll taxes, benefits, overhead, insurance, and indirect costs such as management, safety oversight, training, and site mobilization or demobilization.
Forecasts can also miss shifts in productivity, rework, absenteeism, weather delays, and rules linked to union agreements, prevailing wages, and overtime. When those items don’t make it into the model, budget variance can grow fast.
How often should labor forecasts be updated?
Labor forecasts should be updated on a continuous basis so budgets stay in line with what’s happening on the project right now.
Monthly or quarterly reviews can help you spot variances and track performance. But the best approach is to reforecast in real time as project progress, productivity data, and market conditions shift. That way, small issues don’t snowball into major financial setbacks.
What data should be connected for accurate labor forecasting?
For accurate labor forecasting, bring internal and external data into one platform. The main inputs include historical payroll, attendance, performance metrics, project schedules, crew availability, site requirements, compliance data, local market indicators, weather patterns, and broader economic trends.
ABLEMKR supports this by centralizing these inputs to improve workforce deployment accuracy.


