
The short answer: grid projects are not being held back by plans alone. They are being held back by worker supply, especially for linemen, high-voltage electricians, operators, and CDL drivers.
If I boil this article down, here’s what matters most:
- Linemen are the tightest labor pool. There were about 127,400 lineworkers in 2024, but BLS shows 10,700 annual openings, mostly from people leaving the trade.
- Electricians are a bigger pool, but still under strain. The U.S. has about 818,700 electricians, with about 81,000 annual openings.
- Operators and CDL drivers matter more than many teams expect. Grid work depends on moving heavy gear, and these roles are being pulled by construction, freight, oil and gas, and other sectors at the same time.
- The hardest-hit regions are Texas, the Gulf Coast, the Midwest transmission corridors, and parts of the Southeast and Mid-Atlantic.
- Retirements are a big part of the problem. For lineworkers, most openings come from replacement demand, not new job growth.
- Hiring plans need to start early. In many markets, crews should be lined up 6 to 12 months ahead of key project dates.
- Credentials can shrink the usable labor pool fast. OSHA, NFPA 70E, HAZWOPER, CPR, First Aid, and utility-specific safety rules all affect who can actually show up and work.
Here’s the core point in plain English: you can have funding, permits, and equipment lined up, but if you do not have the right certified crews in the right place, the job slows down.
A lot of the article also explains how labor gaps are measured. It looks at:
- BLS projections for long-range hiring pressure
- Project-based labor models that turn miles, MW, or spend into crew demand
- Regional readiness scores that show whether local hiring is enough or if traveling crews are needed
What I take from the data is simple: the labor market is tight, local supply is uneven, and staffing risk is now a front-end project issue, not just a field issue.
| Trade | Main issue | Where pressure is strongest |
|---|---|---|
| Linemen | Small labor pool, retirements, long training path | Texas, Midwest corridors, Southeast, Mid-Atlantic |
| Electricians | High demand across utility and non-utility work | Texas, Gulf Coast, Southeast, data-center markets |
| Operators | Competing demand from many sectors | Rural transmission builds, Gulf Coast, Plains |
| CDL Drivers | High turnover, freight competition | Texas, Great Plains, multi-state build corridors |
So if you are reading this to plan staffing, the message is direct: do not treat labor as a late-stage item. Treat it like a main project input, right alongside equipment, routing, and schedule.
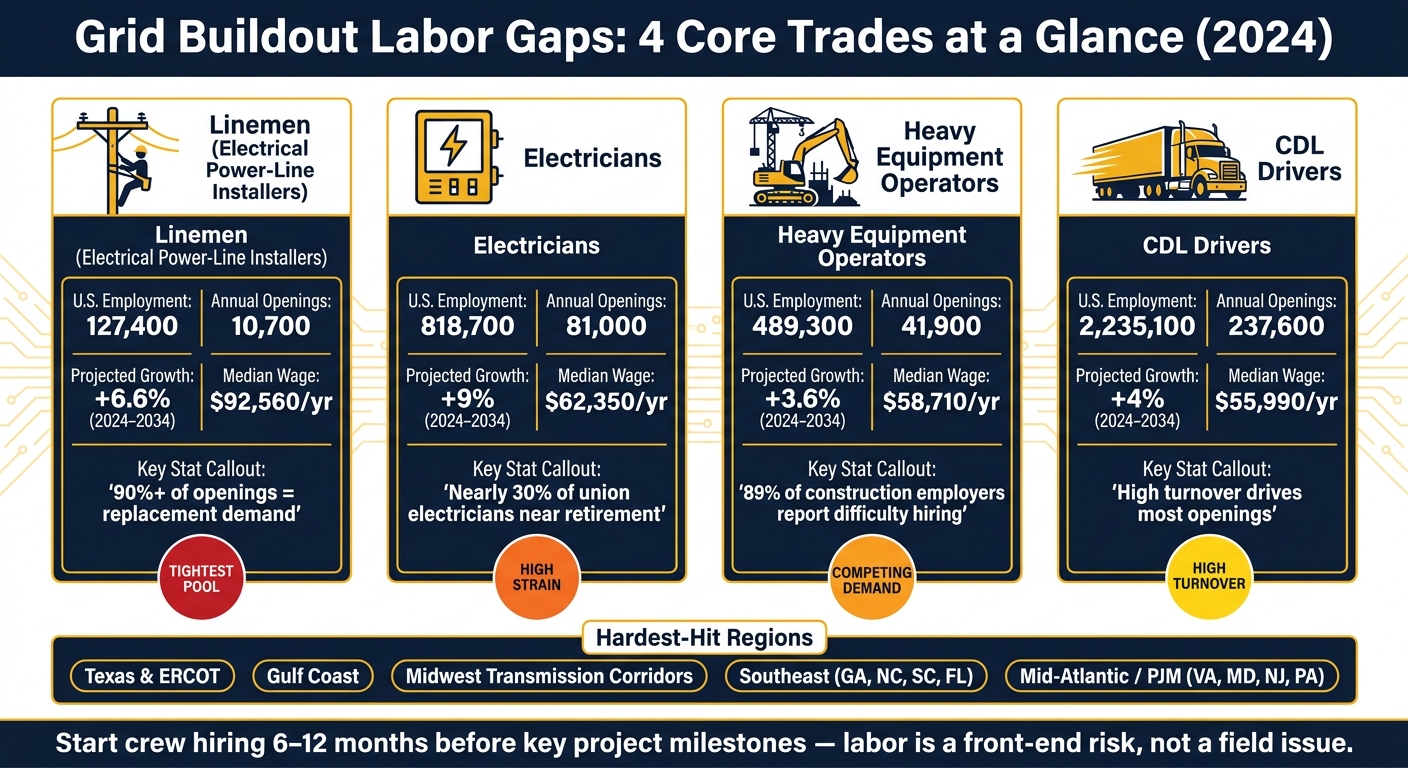
Grid Buildout Labor Gaps: Key Stats for 4 Core Trades (2024)
Labor Trends for the 4 Core Grid Buildout Trades
Linemen and Electrical Trades
Linemen remain one of the most important groups in any grid buildout, and the labor picture is tight. Electrical power-line installers and repairers totaled 127,400 workers in 2024. The BLS projects that number will reach 135,800 by 2034, which works out to 6.6% growth.
That growth sounds solid at first glance. But the bigger issue isn’t just adding new workers. It’s replacing the ones who leave. BLS expects about 10,700 annual openings, and more than 90% of those openings come from replacement demand rather than net job growth.
Earlier utility survey data points to the same problem from another angle. 27.1% of lineworkers were eligible to retire within five years, and another 13.7% were likely to leave for other reasons. Put together, that suggests around 30,000 positions across the industry need to be backfilled.
Electricians are a much larger labor pool, but they’re under similar pressure. National employment stands at 818,700, with 9% projected growth through 2034 and about 81,000 annual openings. At the same time, nearly 30% of union electricians are at or near retirement age.
Operators and CDL Drivers
Grid work also runs on support labor. Heavy equipment operators and CDL drivers move poles, transformers, and other heavy gear to transmission, substation, and utility sites. The work often comes with odd hours, long drives, and schedules that can change fast.
Heavy equipment operators (SOC 47-2073) account for about 489,300 workers nationally, with roughly 41,900 annual openings. CDL drivers make up a far larger labor pool at about 2,235,100 workers, yet the churn is much heavier: about 237,600 annual openings, driven mostly by turnover and replacement demand.
The catch is simple: grid employers aren’t hiring in a vacuum. The same operators and drivers are also being pulled by construction, oil and gas, mining, logistics, and general freight. That puts grid contractors in a tough spot, especially when projects are time-sensitive and equipment can’t move itself.
Construction employers working in transmission, distribution, and storage report 89% difficulty finding qualified workers. In those reports, operators and drivers keep showing up alongside linemen and electricians as major labor gaps.
Table: Labor Snapshot by Occupation
| Occupation | U.S. Employment (2024) | Projected Growth (2024–2034) | Annual Openings | Median Annual Wage | Typical Training / Licensing |
|---|---|---|---|---|---|
| Electrical Power-Line Installers & Repairers (Linemen) | 127,400 | +6.6% | 10,700 | $92,560 | 3–4 yr apprenticeship; high-voltage and safety training; OSHA compliance |
| Electricians | 818,700 | +9% | 81,000 | $62,350 | 4–5 yr apprenticeship; state/local license required |
| Heavy Equipment Operators | 489,300 | +3.6% | 41,900 | $58,710 | Vocational training or OJT; equipment-specific certifications; OSHA safety training |
| CDL Drivers (Heavy & Tractor-Trailer) | 2,235,100 | +4% | 237,600 | $55,990 | Class A or B CDL; state exam; endorsements vary |
These national labor shortages get sharper once you zoom in by region. Transmission corridors, utility hubs, and freight-heavy states often end up chasing the same crews at the same time.
sbb-itb-aa28329
Regional Talent Pools and Demand Hotspots
Midwest and Great Plains Transmission Corridors
Labor shortages hit hardest where the biggest transmission projects are piling up. In the Midwest and Great Plains, that pressure is building fast.
MISO approved a $10.3 billion transmission plan in 2022, then added another large portfolio in 2024. Those projects target corridors across Minnesota, Wisconsin, Iowa, the Dakotas, Missouri, Illinois, and Michigan. SPP also approved a $7.7 billion transmission build tied to a 20-year planning horizon across Kansas, Oklahoma, Nebraska, and parts of Texas and Arkansas.
That means years of steady demand for line crews, substation electricians, operators, and CDL drivers. The catch? A lot of this work sits in rural counties where the labor bench is already thin. Michigan’s LRTP Tranche 1 alone is expected to create approximately 4,100 jobs.
The Midwest still has utility and union training pipelines in place, which helps. But that edge is getting worn down by retirements and head-to-head competition from manufacturing and construction. In the Great Plains, the problem is sharper: smaller local labor pools, less training capacity, and fewer new entrants. In many of these corridors, contractors lean on traveling crews because there just aren’t enough local workers to cover demand.
Farther south, the labor squeeze gets even tighter as power demand grows faster than local training programs can keep up.
Texas, Gulf Coast, Southeast, and Mid-Atlantic Pressure Points
Texas is already tight on labor. ERCOT‘s large-load interconnection queue reaches into the hundreds of gigawatts, pushed by data centers, industrial demand, and new generation. At this point, workforce supply sits alongside equipment lead times as a main bottleneck.
Across the state, utilities and contractors are short on transmission lineworkers and substation electricians. On the Gulf Coast, utilities are hiring experienced craft workers straight into utility roles, which leaves contractors with a smaller hiring pool. Add storm hardening and industrial expansion near Houston and Corpus Christi, and the strain on linemen, operators, and CDL drivers keeps growing.
In the Southeast and Mid-Atlantic, the pattern looks a little different, but the result is the same. Demand is climbing faster than local training pipelines can feed workers into the field. Florida Power & Light’s $49.6 billion capital program is drawing heavily from labor pools in Florida and nearby states. In the Mid-Atlantic, Northern Virginia’s data-center corridor is stretching IBEW Local 26 capacity and tightening the supply of protection and control technicians.
The Charlotte-Atlanta-Raleigh corridor is dealing with much of the same pressure. In 2024, 59% of utility employers reported difficulty hiring line workers. Data-center growth is moving faster than local training programs, which pushes more projects toward traveling crews and more expensive local labor.
The scale changes by region, but the staffing pattern doesn’t: projects move faster where labor pools run deeper.
Table: Regional Demand and Talent Sufficiency
| Region | Primary Buildout Drivers | Core Trades Under Pressure | Talent Sufficiency Status |
|---|---|---|---|
| Upper Midwest / MISO North (MN, WI, IA, MI) | Renewables integration, reliability upgrades | Linemen, substation electricians, heavy equipment operators | Moderate supply, seasonal strain |
| Great Plains / SPP (KS, NE, OK, ND, SD) | Renewable interconnection, long-distance export lines | Journeyman linemen, substation specialists, CDL drivers | Persistent shortage |
| ERCOT / Gulf Coast (TX) | Industrial load growth, storm hardening, data centers | Transmission linemen, substation electricians, CDL drivers | Structurally tight |
| Southeast (GA, NC, SC, FL) | Storm hardening, EV and industrial load, nuclear-related work | Linemen, high-voltage electricians, P&C technicians | High pressure |
| Mid-Atlantic / PJM (VA, MD, NJ, PA) | Data centers, generation interconnections, reliability | P&C technicians, high-voltage electricians, linemen | Severe shortage |
The next section shows how studies measure those gaps.
The Lineman’s Ladder: $15 an Hour to $115K (The Grid Needs 750,000 Workers)
How Studies Measure Workforce Gaps
The regional picture in the previous section comes from real data. But that data is built in different ways, and each method has its own strengths and blind spots. If you’re managing a project, that difference matters. It shapes how you read the numbers, how much confidence you place in them, and how you turn them into staffing plans.
Demand Modeling, Replacement Demand, and Readiness Indices
Most workforce gap studies for grid trades use three main approaches. In practice, researchers often combine them.
The first is BLS-based projection. BLS projections estimate long-term openings by combining net growth with replacement demand. And here’s the key point: most openings come from retirements and job changes, not net expansion. That matters long before a single new transmission mile is built, because it means the labor problem often starts with backfilling workers who leave.
The second approach is employment-factor modeling. This method takes a project pipeline – miles of line, substation count, or total capital spend – and converts it into occupation-specific labor estimates using staffing coefficients. For transmission construction, studies report an average of 0.61 job-years per MW and roughly 0.04 permanent jobs per MW for operations and maintenance. A transmission build can also turn miles of line into expected demand for linemen, CDL drivers, and equipment operators by project phase. One thing to keep straight: job-years measure labor over time, not peak headcount. That’s why this method is so useful when you need to translate scope into crew counts.
The third approach is readiness indexing. Instead of forecasting demand, it looks at whether a region can supply the workers a project needs. These indices combine current employment levels with training capacity, certification supply, wages, and worker mobility to score regions on a readiness scale. So a region might seem fine on paper because it has enough electricians, but still come up short on line crews or CDL drivers when it’s time to move.
Each method answers a different planning question.
Table: Workforce Gap Methods and Outputs
| Method | Primary Inputs | Typical Outputs | Best Used For |
|---|---|---|---|
| BLS Projections | Historical employment, retirement and transfer rates, macroeconomic growth | Annual job openings, 10-year growth %, replacement demand share | Long-range national and state planning |
| Employment-Factor Models | Project pipeline (MW, miles, $ spend), staffing coefficients by trade | Job-years by phase and occupation, peak headcount estimates | Project-level demand forecasting |
| Readiness Indices | Local employment, apprenticeship completions, training capacity, wages | Regional readiness scores, training gaps | Identifying where local hiring is feasible vs. where labor must be imported |
BLS projections show how many workers the sector will need at the national level. Employment-factor models show which trades a given project will use and when. Readiness indices show whether a region can supply those workers on schedule.
The catch is simple: these are planning tools, not promises. Permitting delays, supply chain disruptions, and weather can all shift labor demand away from model estimates. That’s why project managers get the most use from these methods when they treat the numbers as ranges, then test them against live signals like bid responses, hiring timelines, wage pressure, and worker availability.
Used together, these methods help answer a few practical questions:
- Can this project hire locally?
- Will it need traveling crews?
- Should labor be staged earlier than planned?
Those are the staffing issues the next section builds on.
What the Findings Mean for Project Staffing and Workforce Deployment
Takeaways for Contractors, Utilities, and Field Employers
Regional labor gaps don’t stay on paper for long. They show up fast in project schedules.
For grid work, staffing comes down to one thing: finding certified workers who can travel and arrive in the right place at the right time. A large labor pool by itself doesn’t fix a shortage if those workers aren’t available where the job is happening.
That’s why crew planning needs to start 6–12 months before major milestones. When projects overlap in places like the Midwest and Gulf Coast, wage pressure climbs and crew commitments take longer to lock in. The AGC and ABC reported that 92% of firms had trouble filling open positions in 2025, and 45% said those hiring problems caused project delays.
Compliance adds another layer. Workers may be available, but that doesn’t mean they’re deployable. Requirements such as OSHA-30, NFPA 70E, HAZWOPER, and utility safety programs can shrink the usable labor pool fast. In many cases, expired CPR/First Aid or HAZWOPER credentials lead to last-minute deployment failures.
Why Labor Ops Platforms Matter in Tight Markets
In a tight labor market, credential control is not just paperwork. It directly affects whether crews can deploy on time.
ABLEMKR connects utilities and infrastructure contractors with pre-vetted linemen, operators, CDL drivers, and electrical trades based on certifications, safety training, availability, and location. Employers get real-time worker status, credential visibility, payroll workflows, and compliance tracking. Workers get faster access to paid opportunities and on-time payments.
Conclusion: Clearest Talent Pools and Biggest Gaps
The data point to a simple rule for deployment: match the right credentials to the right region before crews mobilize.
Two constraints stand out. Linemen and high-voltage electrical trades face the tightest labor squeeze. Long apprenticeships, retirements, and competing demand from renewables and grid hardening all put pressure on supply. CEWD projects major retirement losses in critical utility trades over the next five years.
Operators and CDL drivers have a bit more flexibility overall, but local shortages still bite when large industrial, energy, and infrastructure projects overlap. The heaviest buildout pressure is in Texas, the Gulf Coast, the Midwest transmission corridors, and parts of the Mid-Atlantic and Southeast, where replacement demand stacks on top of growth demand. In that kind of market, real-time labor data and pre-verified credentials often make the difference between an on-time project and a delayed one.
FAQs
Why are linemen the biggest bottleneck?
Linemen are one of the biggest bottlenecks in the field. The reason is simple: these are specialized jobs that take years of training and certification, and the labor pipeline isn’t turning out enough people to keep up with demand.
The problem gets worse when you look at who’s already in the workforce. Nearly 30% of union electricians are nearing retirement, which puts even more pressure on hiring. And because line work is dangerous, contractors can’t just swap in less-qualified workers to fill the gap. If they do, they risk delays, fines, or even stop-work orders.
When should grid projects lock in crews?
Grid projects need to lock in crews early. That means shifting from reactive hiring to proactive workforce mapping.
In plain English: don’t wait until labor gaps show up on the jobsite.
Instead, line up labor needs with key project milestones like notice to proceed, mechanical completion, and commissioning. That gives teams a clearer view of when crews will be needed and helps secure capacity before labor shortages slow construction or push back interconnection timelines.
Tools like ABLEMKR can help by matching pre-vetted workers based on certification and location for upcoming work.
Which regions face the worst labor shortages?
Labor shortages hit hardest in places where project demand is moving faster than the local pool of skilled workers. That gap is especially sharp in states with fast infrastructure growth, including Virginia, Texas, Ohio, Arizona, and Georgia. In those markets, companies are fighting for the same electricians, engineers, and heavy equipment operators.
Rural and deindustrialized areas feel the strain too, but for a different set of reasons. Training options are often limited, and many younger workers leave for urban centers. The result is a thinner hiring pool and a tougher road for employers trying to staff jobs. In these markets, vacancy rates for critical roles can top 20%, which often means project delays and higher costs.


