
Labor costs are unpredictable and among the largest expenses for contractors, especially in construction and energy industries. Factors like weather, site conditions, and worker shortages can disrupt budgets and schedules. To manage this uncertainty, project managers turn to multi-scenario forecasting. This approach involves creating three labor cost estimates: optimistic, likely, and pessimistic, accounting for variables like wage rates, productivity, and crew availability.
Key takeaways:
- Labor costs include direct wages and indirect expenses (e.g., taxes, insurance, benefits).
- Indirect costs can increase wages by 25–50%.
- Accurate forecasting relies on reliable data, such as payroll history and productivity metrics.
- Real-time tracking tools and scenario planning help minimize cost overruns.
- Regular updates to forecasts ensure alignment with actual project conditions.
How to do accurate construction job cost forecasting with Prophix One™ FP&A Plus
sbb-itb-aa28329
Key Drivers of Labor Costs
Understanding labor costs requires a deep dive into the many factors that influence them. It’s not just about wages – there are numerous variables at play, and overlooking any one of them could lead to inaccurate forecasts.
Direct and Indirect Labor Costs
Labor costs fall into two main categories: direct costs (like wages, overtime, and shift differentials) and indirect costs. Indirect costs, often referred to as the “labor burden”, can be trickier to calculate but are just as important.
The labor burden includes expenses like payroll taxes (FICA, Medicare, and state unemployment taxes, which typically add around 7.65% plus an additional 1–2%), workers’ compensation insurance (ranging from 8–40% of wages depending on the trade and location), health insurance, paid time off, and union fringe benefits. For union workers, fringe contributions alone can add $15–$25 per hour. Combined, these costs often increase base wages by 25–50%. For example, a journeyman electrician earning $38 per hour might actually cost closer to $53.96 per hour once these additional expenses are factored in.
“Labor costs include both direct wages and indirect expenses like insurance, taxes and benefits.” – James Harden, Professional Cost Estimator, Pro Estimating Services
Indirect labor costs go beyond wages and benefits. They also include supervision, mobilization time, safety meetings, weather delays, and rework. These non-productive hours can account for 20–30% of total labor costs if left unmanaged.
Data Sources for Accurate Inputs
Accurate labor cost forecasting starts with reliable data. Payroll history and job cost reports are invaluable for understanding crew productivity and local market conditions. For public works or government projects, prevailing wage determinations under the Davis-Bacon Act and union agreements provide baseline rates that must be factored into estimates.
While published cost books and estimating databases can be helpful for new tasks, they need to be adjusted to reflect your company’s actual performance. National averages often fail to account for local labor market specifics, making them less reliable for precise bidding.
Time tracking is another critical component. Errors in manual data entry – ranging from 1–4% – can lead to significant financial impacts. For instance, these errors could cost about $4,285 per worker annually. On a 200-person crew, even a small 5% discrepancy in tracking could result in over $832,000 in labor cost uncertainty each year. A real-world example: Dynamic Systems Inc., a mechanical contractor with over 2,500 workers, uncovered $2.6 million in time variances across its projects after switching to biometric time tracking to replace manual methods in 2025.
Consistent and accurate data lays the groundwork for effective scenario modeling and cost control.
Standardizing Cost Inputs
Once you have reliable data, standardizing labor rates and productivity metrics is crucial. This ensures consistency across various scenarios. Productivity metrics can be expressed as output per labor hour (e.g., linear feet of pipe installed per hour) or labor hours per unit (e.g., hours needed per square foot of tile). Distinguishing between these two allows you to identify whether a cost overrun stems from productivity issues (hours per unit) or wage-related factors (dollars per hour).
Project conditions also play a big role. Adjusting base productivity rates for specific conditions – like site access, work height, trade stacking, or weather exposure – is essential. For instance, a tight urban job site or a multi-trade shutdown will impact productivity differently than open-field work.
“A rate is only useful when it is tied to a specific task, crew, unit of measure, and project condition.” – CBConstructionBids.ai Team
Building a Baseline Labor Cost Model
A baseline model serves as your best estimate of costs under normal conditions, acting as the standard against which all other scenarios are measured.
Choosing an Estimation Method
The method you choose depends on your project’s scope. For straightforward, repetitive tasks like drywall or flooring, the unit-rate method is effective. This involves applying a historical cost per square foot or linear foot. For more intricate or multi-trade projects, a crew-based approach works better, as it accounts for the mix of foremen, journeymen, and apprentices. For large-scale projects requiring detailed job costing, bottom-up estimating provides the most precision. This approach calculates hours for each task and multiplies them by fully burdened labor rates.
“A rate from a cost book may not capture your crew skill, local labor availability, site logistics, phasing, weather window, inspection process, or material staging plan.” – ConstructionBids.ai Team
To ensure accuracy, validate these assumptions with field teams. Foremen and site managers often have firsthand insights into how textbook productivity rates compare to actual conditions.
Calculating Labor Hours and Costs
Start by dividing the work quantity by the production rate to determine labor hours. Then, multiply those hours by the fully burdened labor rate. This rate includes not just base wages but also payroll taxes, workers’ compensation, health insurance, union fringes, and paid time off.
“A worker earning $25/hour in base wages often costs $33–$40/hour when fully burdened. This burdened labor rate – not the base rate – should inform job costing calculations.” – Albert Bou Fadel, SmartBarrel
Adjust production rates to reflect specific site conditions. Factors like tight urban spaces, upper-floor work, or multi-trade shutdowns can reduce output in different ways. Additionally, account for non-productive time such as mobilization, safety meetings, and weather delays. These factors, if overlooked, can significantly inflate total labor costs. Together, these calculations establish a reliable foundation for organizing and presenting labor costs.
Structuring and Presenting Costs
Once you’ve built an accurate baseline, organize your data to easily identify cost drivers for scenario comparisons. Separate field labor costs (direct on-site wages) from supervision and indirect costs like mobilization and non-productive time. This structure helps pinpoint whether overruns stem from productivity issues or wage discrepancies.
Develop a labor rate library – a standardized reference tool with columns for scope items, crew mixes, base labor hours, adjustment factors, and data sources. This library keeps your baseline clear and auditable, allowing project managers to trace variances back to specific assumptions rather than combing through spreadsheets. Update these rates and burden calculations quarterly to avoid using outdated numbers, which are a common cause of inaccurate baselines.
“The formula itself isn’t the challenge. The reliability of the accurate data feeding that formula is where accuracy breaks down.” – Albert Bou Fadel, SmartBarrel
A well-structured baseline model lays the groundwork for developing alternative labor cost scenarios with confidence and clarity.
Developing Multiple Labor Cost Scenarios
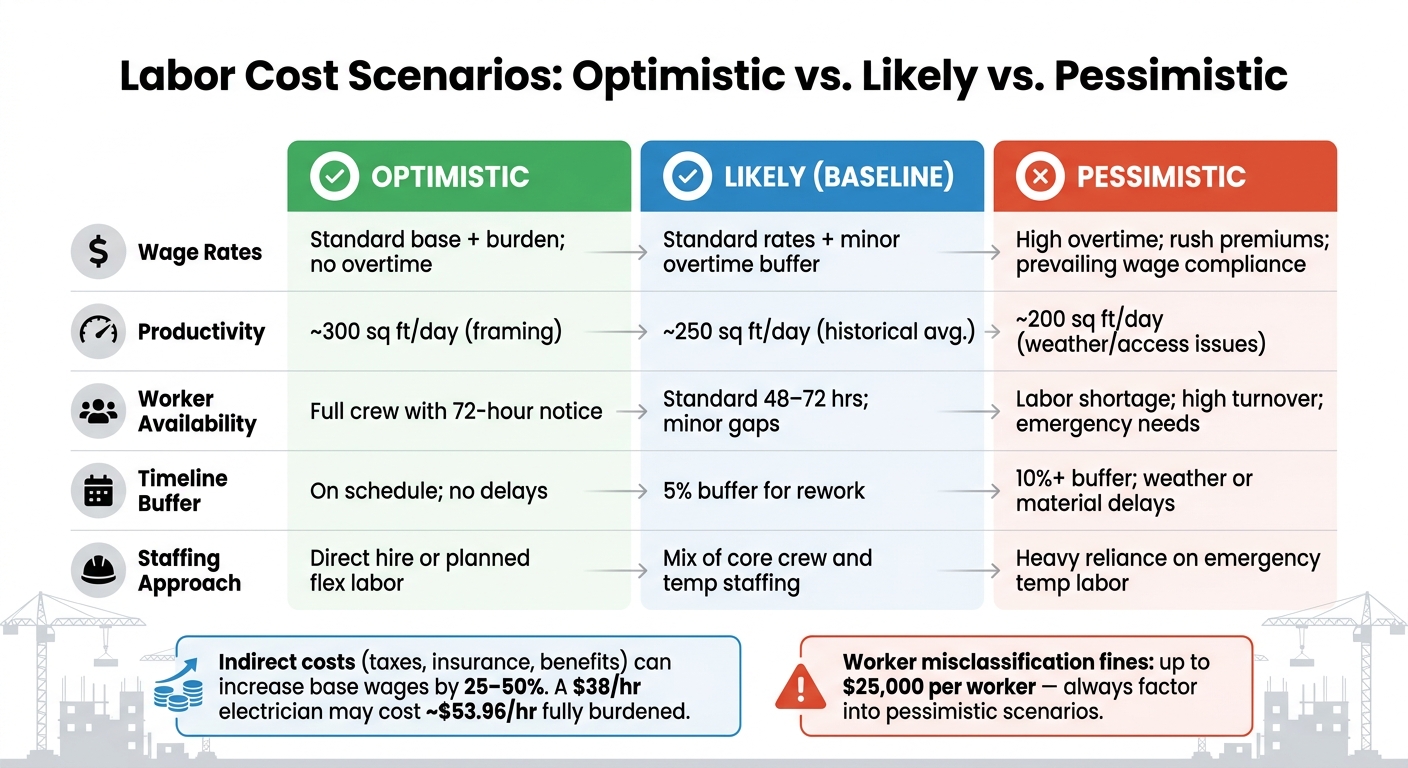
Labor Cost Scenarios: Optimistic vs. Likely vs. Pessimistic
Once you’ve established a baseline model, it’s time to account for the uncertainties that come with any project. The best way to do this? Build three versions of your labor cost forecast – optimistic, likely, and pessimistic – each based on different assumptions about how your project might evolve.
Adjusting Scenario Drivers
Each scenario hinges on four key factors: wage rates, productivity, worker availability, and timeline. Here’s how these variables might play out:
- In the optimistic scenario, you assume standard wage rates, full productivity (about 300 sq ft/day), and no major disruptions.
- The likely scenario builds in a modest 5% buffer for rework, reflecting a more realistic pace of progress.
- The pessimistic scenario accounts for reduced productivity, higher overtime costs, and rush premiums, especially for last-minute staffing needs .
When planning for the worst-case scenario, don’t forget to include fully burdened labor rates. These should factor in overtime, emergency hires, and compliance with prevailing wage laws. For example, workers’ compensation insurance alone can range from $24 to $80 per $100 of payroll in high-risk trades.
By defining these drivers, you can better prepare to adapt your forecasts as new data becomes available.
Using Real-Time Data for Scenario Planning
Static assumptions can only take you so far. Instead, use a rolling 2–4 week look-ahead to predict trade labor needs. While standard roles require advance notice, specialized positions often come with premium costs if hired on short notice. Rush premiums and overtime charges can quickly inflate budgets.
Platforms like ABLEMKR can make this process easier. They provide real-time insights into worker availability, certifications, and transparent billing rates. Features like GPS-verified time tracking and digital credential management also help minimize administrative errors, keeping your labor cost assumptions accurate mid-project.
Comparing Scenarios with Tables
Once you’ve adjusted your variables, consolidate the three scenarios into a comparison table. This makes it easy to see where costs vary most and which assumptions pose the highest risks. Instead of treating all uncertainties equally, you can focus your contingency planning where it’s needed most.
| Driver | Optimistic | Likely | Pessimistic |
|---|---|---|---|
| Wage Rates | Standard base + burden; no overtime | Standard rates + minor overtime buffer | High overtime; rush premiums; prevailing wage |
| Productivity | ~300 sq ft/day (framing) | ~250 sq ft/day (historical avg.) | ~200 sq ft/day (weather/access issues) |
| Availability | Full crew with 72-hour notice | Standard 48–72 hours; minor gaps | Labor shortage; high turnover; emergency needs |
| Timeline | On schedule; no delays | 5% buffer for rework | 10%+ buffer; weather or material delays |
| Staffing Approach | Direct hire or planned flex labor | Mix of core crew and temp staffing | Heavy reliance on emergency temp labor |
“Scenario planning prepares contractors for the fact that construction projects do not always go according to plan.” – Tower8Staffing
One critical risk to consider in pessimistic scenarios is worker misclassification. Misclassifying W-2 employees as 1099 contractors can lead to fines of up to $25,000 per worker. This is a costly liability that must be factored into any high-risk forecast.
Monitoring and Updating Labor Cost Forecasts
Once your baseline model and scenario planning are in place, the real work begins – keeping your forecasts aligned with actual project conditions. A forecast that isn’t updated regularly is just a guess. As your project progresses, the key is to compare your original plan with real-world performance and adjust quickly when things don’t go as expected.
Tracking Variances and Performance
Let’s say your framing crew is supposed to install 300 sq ft of drywall daily but only manages 240 sq ft. That gap signals a potential cost overrun, and catching it early can prevent bigger issues. Weekly reviews using a Work Breakdown Structure (WBS) can help you zero in on where things are going off track.
| Tracking Method | What It Measures | Why It Matters |
|---|---|---|
| Production Rate Monitoring | Actual output vs. planned rate | Identifies bottlenecks before they grow |
| Work Breakdown Structure (WBS) | Hours and costs by task and trade | Pinpoints the source of overruns |
| Actual vs. Forecast Variance | Projected vs. actual cost and hours | Highlights inaccurate estimates that need quick fixes |
| Schedule Performance Index (SPI) | Earned value divided by planned value | Shows if the project is ahead (SPI > 1) or behind schedule (SPI < 1) |
Good communication between project managers, foremen, and staffing partners is critical to addressing these variances effectively.
Risk Quantification and Contingency Planning
What happens if there’s a five-day weather delay or a sudden 20% labor shortage? By preparing detailed “what-if” plans, you can respond immediately when disruptions occur. A risk matrix helps evaluate each potential issue by its likelihood and financial impact, allowing you to set appropriate contingency budgets.
For example, high-impact risks like seasonal labor shortages or unexpected permit delays require tailored backup plans – not generic contingencies. Design changes and inspection delays are also common culprits for labor cost variances, so keeping a close eye on these factors is crucial.
Static budgets set at the start of a project don’t cut it anymore. Rolling forecasts that are updated with real-world data are far more accurate. With U.S. construction spending growing by about 6% in both 2023 and 2024, labor markets are tighter and more unpredictable than ever, making static assumptions a risky approach.
Using Technology to Update Forecasts
Technology is a game changer when it comes to keeping your labor cost forecasts accurate. Real-time digital tools let you spot issues as they happen.
Take ABLEMKR, for example. It offers GPS-verified time tracking, integrated payroll workflows, and compliance tracking – all in real-time. If your forecast shows you need more crew, ABLEMKR’s automated job-matching feature connects you with pre-vetted workers based on availability and location. This ensures you can meet deadlines without scrambling. Plus, transparent billing rates and real-time invoicing keep your cost-to-complete calculations up to date.
Forecasting tools that combine historical productivity data, current labor rates, and live field inputs give project managers a clear, real-time financial picture. Armed with this information, you can make decisions that are timely and well-informed.
Conclusion: Best Practices for Labor Cost Forecasting
Getting labor cost forecasting right starts with clean data, realistic expectations, and a flexible approach. Don’t overlook indirect costs like payroll taxes, workers’ compensation, and benefits – they can increase direct wages by 25% to 50%, so factoring them in early is key.
In today’s unpredictable labor market, planning for different scenarios is a must. Preparing optimistic, baseline, and worst-case forecasts ahead of time can help your team navigate unexpected challenges with less stress.
To stay on top of cost variances, regular monitoring is non-negotiable. Weekly rolling forecasts and on-site check-ins allow you to catch productivity issues early and keep expenses under control.
Using tools like ABLEMKR can make a big difference. By automating GPS-verified tracking and worker matching, platforms like this help you quickly adjust crew deployment and manage costs in real time. Shifting from fixed to variable labor costs gives you more precise cost-to-complete figures. At the heart of it all is standardized, accurate data – this is what keeps your forecasting model reliable and effective.
FAQs
What should I include in a fully burdened labor rate?
A fully burdened labor rate represents the complete cost of employing a worker. It includes not just their base wage or salary but also additional expenses like benefits, payroll taxes, paid time off, training, travel, equipment, and other overhead costs. This comprehensive calculation provides a clearer picture of the true expense associated with each employee.
How do I set realistic productivity rates for each scenario?
To create realistic productivity rates, begin by referencing established construction productivity benchmarks. Tools like RS Means can help, especially when adjusted for regional differences. It’s essential to factor in variables such as crew skill levels, the complexity of tasks, and specific site conditions. Incorporating historical data and feedback from the field can refine these benchmarks, ensuring they align closely with actual performance. Workforce budgeting tools, such as ABLEMKR, add another layer of precision by offering real-time tracking and scenario modeling.
How often should I update my labor cost forecast during a project?
Keeping labor cost forecasts accurate requires regular updates, especially as project conditions evolve. It’s a good practice to review and adjust these forecasts at least once a month or whenever major changes happen – like alterations in project scope, shifts in the schedule, or changes in resource availability. Regular updates ensure your estimates stay relevant and aligned with the project’s current demands.


