
If your staffing forecast is wrong, your schedule and labor budget can slip fast. I’d treat staffing projections as a time-based plan for labor hours, headcount, trade mix, crew timing, and closeout tapering from bid stage to final turnover.
Here’s the short version:
- I start with scope, quantities, and the baseline schedule
- I convert quantities into labor hours and man-days
- I spread those hours by trade, phase, and zone
- I test crew size, shift pattern, and overtime limits
- I update the plan at milestones and change events
- I track planned vs. actual hours every week
- I taper crews during punch list, commissioning, and closeout
- I use live workforce tools to keep the forecast tied to who is actually available
A few numbers shape the whole process:
- Labor can account for 30%–50% of direct project costs on labor-heavy jobs
- A common space rule is about 1 worker per 200 sq. ft. of usable area
- Output below 80%–85% of plan usually needs action
- Weather delays often add about 3%–5% to project duration
- Long overtime stretches above 50–60 hours per week tend to cost more and produce less
I’d sum it up this way: build the first forecast early, update it at set milestones, and compare it to field data every week. That is how you keep labor aligned with the job instead of reacting late.
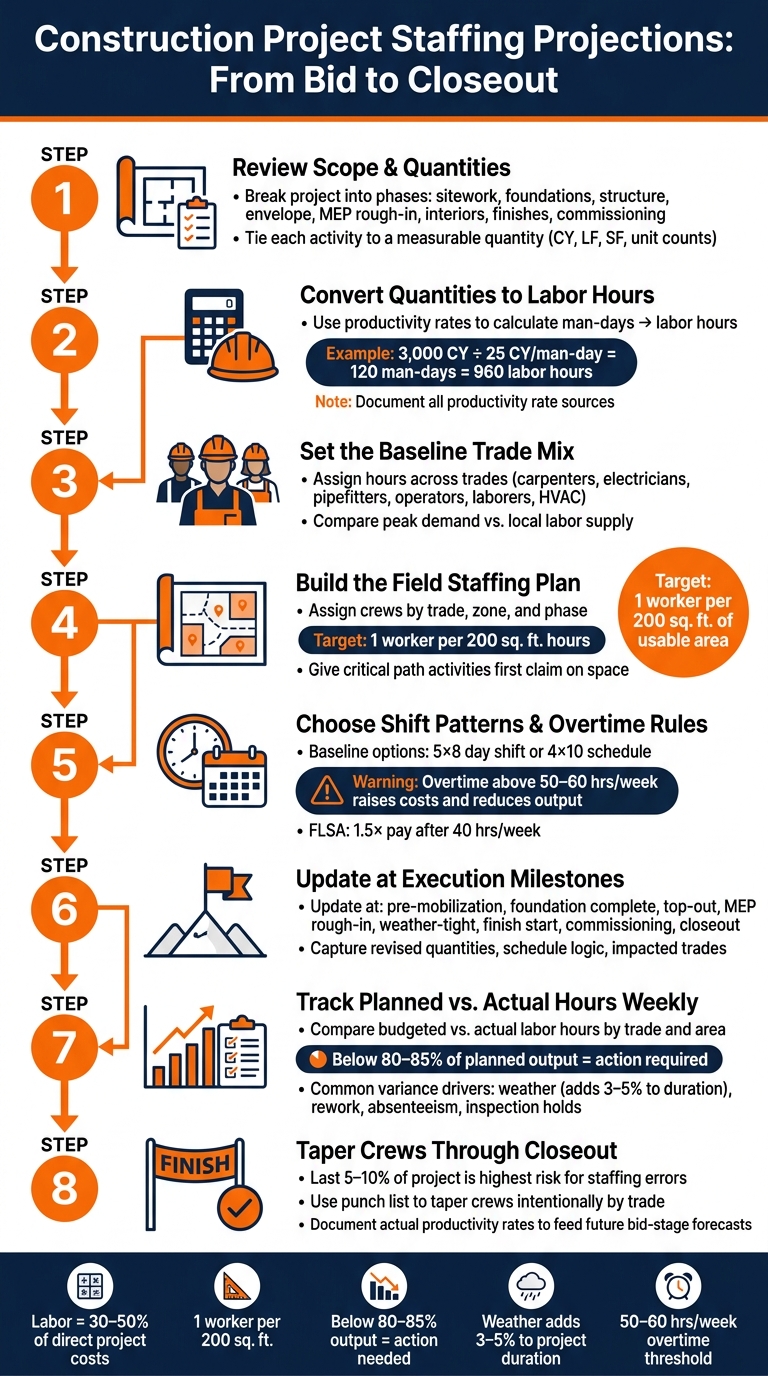
Construction Project Staffing Projections: Step-by-Step Process
How to Master Project Prediction: From Uncertainty to Success
sbb-itb-aa28329
Build the first staffing projection at bid stage
The bid stage is when the first real staffing numbers hit the page. At this point, you usually have drawings, specs, a baseline schedule, and enough scope detail to build a labor forecast you can stand behind. The target is simple: set a baseline for total labor hours, peak headcount by trade, and phase timing. Those numbers become the basis for labor hours.
Review scope and quantities before assigning labor
Start by breaking the project into phases that match how crews will actually work in the field: sitework, foundations, structure, envelope, MEP rough-in, interiors, finishes, and commissioning.
Within each phase, define clear activities and tie each one to a measurable quantity. For concrete work, use cubic yards. For piping and conduit, use linear feet. For drywall and flooring, use square feet. For mechanical equipment, use unit counts like air handling units, pumps, and switchgear.
Then group those quantities by phase and location. For example, North wing mechanical piping – 1,800 LF. That gives you a better read on where and when each trade will be needed, not just the total amount of work. From there, those hours roll up into trade-by-trade demand.
Convert quantities into labor hours and crew curves
Once the quantities are set, turn them into labor hours. Use your own past project data first. If you don’t have that, use industry benchmarks as a backup.
The math is pretty direct. Convert quantity and productivity into man-days. Then convert man-days into labor hours based on shift length. Say a concrete crew pours at 25 CY per man-day and the foundation scope is 3,000 CY. That comes to 120 man-days, or 960 labor hours at 8 hours per day. If the work spans 10 weeks, that points to a small weekly concrete crew, plus support labor for formwork and rebar. Mapped week by week, those hours become the first time-phased labor curve for that trade.
Write down the productivity rates you use. Be specific about where each rate came from:
- a past project
- a published manual
- a field estimate
Also note any changes for congestion, height, weather, night work, and other field constraints. Location matters too. Prevailing wage, union rules, weather, and local permitting or inspection practices can all affect productivity and crew size. That paper trail makes later updates much easier once the job is awarded and real production data starts to come in.
Set the baseline trade mix
After you calculate labor hours by activity, assign those hours across the crafts that will actually perform the work: carpenters, electricians, pipefitters, equipment operators, laborers, HVAC installers, and others tied to the work package.
This gives you the baseline trade mix: how many hours and workers each trade needs, by phase.
Next, compare peak trade demand with local labor supply. If the peak doesn’t look realistic, fix it before award. That may mean resequencing the work, moving some scope offsite, or changing the staffing assumption. If the peak is too high, revise the bid-stage assumptions before the plan gets locked in. That trade mix then becomes the field staffing plan.
Turn the baseline into a field staffing plan
Take the baseline and turn it into a zone-by-zone staffing plan with clear crew assignments and shift rules. The goal is simple: put the right trade in the right place at the right time, without stacking too many people into the same area.
Plan crews by trade, area, and phase
Start with the schedule’s work breakdown structure, then split the project into clear zones. That might mean building wings, floor levels, mechanical rooms, or exterior areas. From there, assign each trade to a zone for a set time window. This helps trades move in sequence instead of tripping over each other in the same space.
Crowded work zones – where multiple trades work at the same time in a tight area – can drag down output and add safety risk on congested job sites. A useful density rule is to target no more than roughly one worker per 200 sq. ft. of usable area.
Give critical path activities first claim on space and access. Trades that drive the critical path – usually structure, enclosure, MEP rough-in, and commissioning – shouldn’t be stuck waiting because non-critical work is in the way.
If a zone can’t fit the crew size you need, change the shift length before you add more labor.
Choose shift patterns and overtime rules
A common baseline on U.S. construction projects is a 5×8 day shift or a 4×10 schedule. Night shifts can help compress the schedule, but they often come with fatigue and output trade-offs.
Overtime needs a hard look too. Under the federal FLSA, non-exempt workers generally must receive 1.5× pay for hours over 40 in a week, and some states add daily overtime rules, including California after 8 hours. Push overtime past 50–60 hours a week for too long, and costs climb while output tends to slip.
Compare staffing scenarios before mobilization
Before crews mobilize, put the main staffing options side by side. Each one affects forecast risk, labor supply, and schedule dependability in a different way.
| Scenario | Cost & Schedule Impact | Supervision Needs | Forecast Risk |
|---|---|---|---|
| Straight time (5×8) | Lowest cost; baseline schedule | Lower – one shift to coordinate | Low: less fatigue, predictable output |
| Two-shift | Moderate cost increase; faster completion | Higher – two superintendents, handoff coordination | Medium: night fatigue, handoff gaps |
| Overtime-heavy | Highest cost; fastest on paper | Elevated – burnout and turnover risk | High: sustained fatigue degrades reliability |
Pick the option that lines up best with milestones, float, and labor supply.
This field plan becomes the working baseline until milestone updates and actual production change it.
Update projections at execution milestones
Use the field plan as your control baseline, then reset that baseline at each milestone. The point isn’t to reforecast every time something small goes sideways. It’s to update on a planned rhythm tied to major execution points, so the team keeps working from a current baseline that can be defended if anyone asks, “Why are we staffed this way?”
Each update should reprice the same baseline using current quantities, current schedule logic, and current field conditions.
Common update points include pre-mobilization, foundation completion, top-out, MEP rough-in start, weather-tightness, finish start, commissioning, and closeout. At each point, validate scope changes, align the plan with the latest CPM schedule, recalculate labor hours by trade, and rebuild crew curves for each trade’s ramp-up, peak, and taper.
Tie updates to milestones and change events
Each milestone marks a shift in who needs to be on site and how many people you need. These updates are revisions to the same baseline trade mix and crew curve built in the prior section, not separate forecasts.
After foundation completion, concrete crews taper off while structural steel ramps up. After structural completion, framing and enclosure crews step in before MEP rough-in starts. And when a big owner-directed change order lands, the labor picture can change fast. Adding a new equipment room, for example, can add several hundred hours of mechanical, electrical, and controls labor, and those hours often move into later phases.
For each change event, capture:
- Revised quantities
- Updated activity durations and logic from the schedule
- Impacted trades and skill levels
- Productivity assumptions for congested or out-of-sequence work
Track schedule risk and planned vs. actual labor hours
Weekly reviews are where teams catch variance before it turns into a bigger mess. Compare budgeted vs. actual labor hours, timesheets by employee and trade, headcount by trade and by area, and installed quantities against the look-ahead schedule.
Then calculate productivity as a percentage of plan. A common benchmark flags activities running below 80% to 85% of planned output as needing action. That matters because variance findings should feed the next staffing update. They’re not just there to fill a report.
A few variance drivers tend to show up again and again: weather delays, inspection holds, rework, absenteeism, and hard-to-fill specialty trades. Weather-related delays can account for an average of 3% to 5% of total project duration on U.S. projects. Staffing and crew issues are often reported as the second-highest source of schedule variance, which is why weekly labor reviews give project teams so much control over the outcome.
Taper crews through punch list, commissioning, and closeout
The last 5% to 10% of a project is where staffing plans often fall apart. Teams either pull people off too early and have to scramble to get them back, or they keep full crews in place too long and burn labor dollars on late-stage work that moves slowly.
Use the punch list and closeout checklist to taper crews with intention. Map each closeout activity to the trades it needs. That may mean specialty technicians for system testing, finish carpenters for punch items, and controls technicians for commissioning. Then set clear rules for when each group can step down.
For example, reduce electrical commissioning technicians by 50% only after 95% of punch items in defined areas are closed.
Also keep a small, defined warranty and turnover team on the schedule through owner training, O&M manual delivery, and final walk-throughs.
At closeout, document actual productivity rates by trade, the variance drivers that caused the most damage, and which staffing adjustments helped the team stay on track. Those actuals should feed straight into future bid-stage production rates.
Use workforce technology to improve staffing accuracy
Once the field plan is in place, technology helps keep the forecast up to date through mobilization, execution, and closeout. Workforce tools keep staffing projections tied to live labor data as crews, schedules, and scope shift.
Where ABLEMKR fits into staffing projections
ABLEMKR matches pre-vetted workers to project needs based on certification, availability, and location. If a projection shows the job needs certified night-shift ironworkers or welders near the site, ABLEMKR’s automated matching helps fill those roles fast and keeps the planned crew curve on pace.
The platform also handles digital onboarding, including I-9s, W-4s, direct deposit, and site orientation acknowledgments. On top of that, it tracks live worker status – who is on site, assigned, available, or off site. It also monitors certification and safety training expiration dates before they turn into a compliance gap. You can see the difference pretty fast when you put static spreadsheets next to live labor tools.
Spreadsheet planning vs. real-time labor operations tools
That gap stands out most in day-to-day labor control.
| Dimension | Spreadsheet Planning | Real-Time Labor Operations Tools |
|---|---|---|
| Data freshness | Manually updated weekly or monthly | Synced continuously from timekeeping and check-ins |
| Worker availability | Shows planned positions, not actual worker status | Tracks each worker’s availability, location, and assignment |
| Mobilization speed | Days; requires calls, emails, and paper forms | Hours; automated matching and digital onboarding |
| Compliance tracking | Static columns that go stale fast | Live certification and training profiles; blocks non-compliant workers |
| Payroll workflow | Manual transfer into payroll systems; prone to errors | Integrated timesheets, overtime rules, and approval chains |
| Projection adjustments | Slow to recalculate; version confusion is common | Instant recalibration when milestones shift or scope changes |
Conclusion: Core steps project managers should follow
Staffing projections stay dependable when they remain connected to live labor data from bid stage through closeout.
FAQs
How accurate should a staffing projection be at bid stage?
At the bid stage, staffing projections are only as good as the baseline data behind them. Project managers should finish thorough takeoffs before they apply labor escalation factors.
Quick methods can help with early planning. But detailed estimating gives you a tighter number. Solid projections also depend on past productivity trends, regional wage rates, and project-specific timelines.
What should I do when actual labor hours exceed the forecast?
Move fast to keep the budget from slipping further. Start by finding the root cause, whether that’s unplanned overtime, weak crew output, or resources assigned to the wrong work.
Then make immediate changes. Reassign workers from non-critical tasks, adjust schedules, or put tighter controls on overtime. Be clear with stakeholders about the issue and your plan to fix it, so they can make informed calls on scope or timeline.
How often should I update staffing projections during construction?
Update staffing projections on a regular rhythm: weekly to watch near-term workforce performance and catch gaps early, and monthly for deeper planning and longer-range adjustments.
When conditions shift fast, update projections more often – sometimes daily or weekly – to reflect labor shortages, weather, or schedule changes. Use real-time tracking data to keep forecasts lined up with what’s happening on the project and the goals you’re working toward.


