
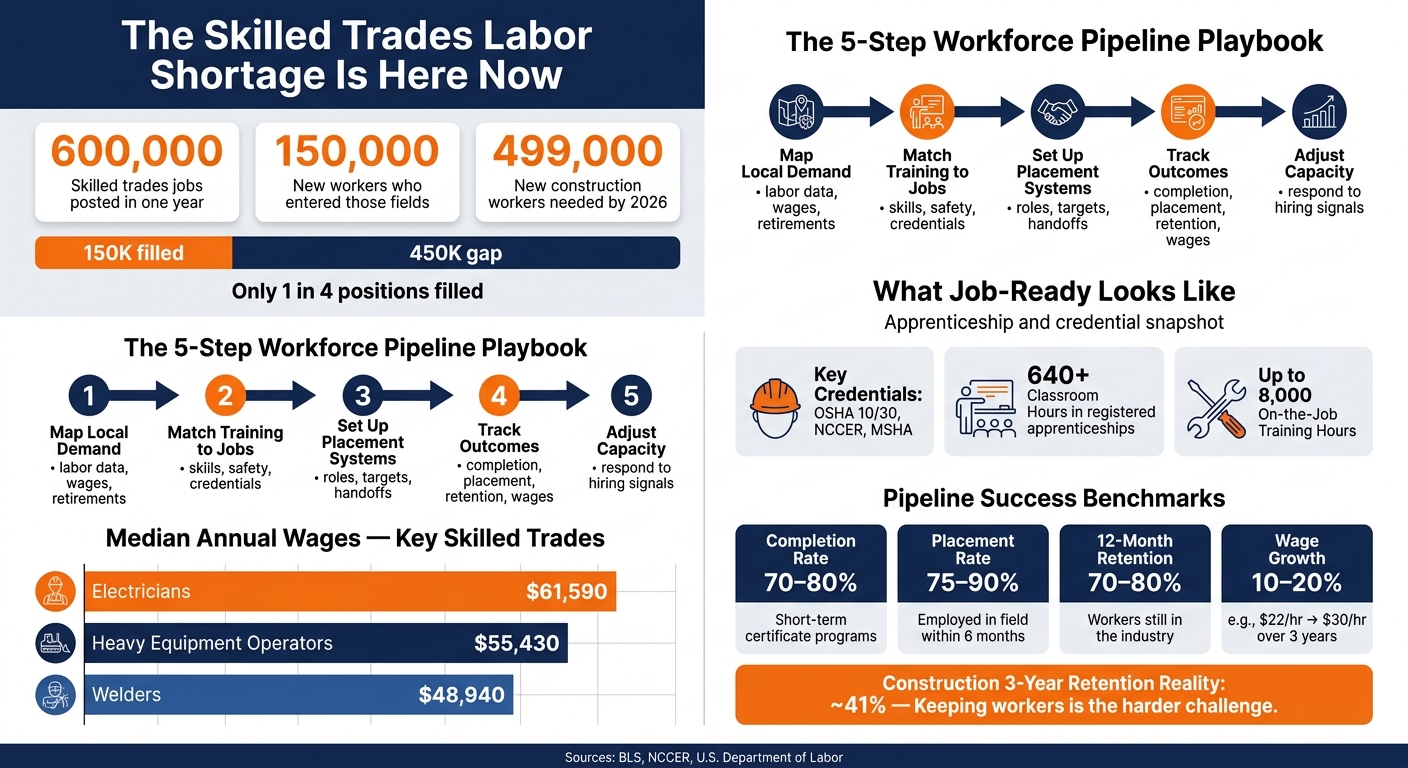
The short answer: colleges and employers need to plan hiring and training together before labor shortages hit. In one year, nearly 600,000 major skilled trades jobs were posted, but only about 150,000 new workers entered those fields. And in 2026, construction alone needs about 499,000 new workers.
If I boil the article down, the playbook is simple:
- Map local demand with labor data, project pipelines, wages, and retirements
- Match training to jobs with clear skills, safety rules, and site-ready credentials
- Set up placement systems with written roles, hiring targets, and jobsite handoffs
- Track results like completion, placement, retention, and wage growth
- Adjust seats and schedules when hiring signals change
This matters because training can miss the market fast. A college may produce 60 electricians a year while local demand calls for 150 openings. That leaves a gap of 90 workers per year. When that happens, employers scramble, students wait, and projects slow down.
A few points stand out right away:
- Workers need job-ready credentials such as OSHA 10/30, NCCER, and MSHA
- Apprenticeships may include 640+ classroom hours and up to 8,000 on-the-job hours
- Electricians earn a median of $61,590, heavy equipment operators $55,430, and welders $48,940
- Retention is a weak spot: construction 3-year retention sits near 41%
So if you run a college program, workforce office, or hiring team, the message is clear: don’t wait for open jobs to pile up. Build one shared system for training, hiring, and follow-up, then review it every quarter.
That’s what the article lays out step by step.
Skilled Trades Labor Gap: Key Stats & Pipeline Metrics
Blue Collar 101: Building Trades & the Path Through Apprenticeship
sbb-itb-aa28329
Step 1: Map Local Labor Demand With Data
Start by sizing up regional demand for each target occupation. Treat your regional labor market as the commuting zone – the area workers and students can reasonably travel across for work or training. Then pull demand and wage data from labor analytics platforms, state workforce dashboards, and BLS benchmarks.
BLS projects 649,300 annual openings across construction and extraction occupations through 2034, and electrician jobs alone are expected to generate about 81,000 annual openings each year over that span.
Use Project Pipelines and Wage Data to Set Training Targets
Labor market data shows the big picture. Planned projects show what’s likely to hit your region next.
Build a list of every major capital project planned over the next 5–10 years: road and bridge work, transmission line upgrades, substation builds, mine expansions, and industrial facilities. Good public sources include state transportation improvement plans, county permitting databases, utility integrated resource plans, and federal infrastructure disclosures.
After that, match each project phase to the jobs it will need and estimate annual headcount. A substation upgrade, for example, may need electricians and equipment operators during construction, then maintenance technicians later on. Spread those staffing needs across the project timeline. Add replacement demand from retirements and turnover, and you end up with an annual openings estimate by occupation.
Now compare that number to current program completions. That’s where the gap shows up. If local programs produce 60 job-ready electricians per year, but regional demand points to 150 annual openings, the target is 90 more completers per year. That single gap estimate can shape cohort size, apprenticeship slots, and credential volume.
Job postings help confirm both demand and wage strength. Electricians earned a median annual wage of $61,590, heavy equipment operators earned $55,430, and welders earned $48,940. When you check those figures against local cost-of-living benchmarks, partners can judge whether the program leads to a job that pays enough to matter. From there, the gap analysis feeds straight into curriculum and credential alignment in the next step.
Build a Shared Dashboard and Review It Quarterly
To keep the demand map up to date, publish it in a shared dashboard. That can live in a BI tool or even a well-built spreadsheet. What matters is that it brings the right data into one place:
- Enrollment
- Completions
- Placement rates
- Projected openings by occupation
- Project status
Give one person clear ownership of updates and data quality. Employer partners and public agencies should also have defined input roles. In practice, the college maintains the dashboard, while employers confirm project changes.
Set quarterly joint reviews with college leaders, faculty, and employer representatives. Use those meetings to compare enrollment trends with demand projections, spot delayed or canceled projects, and make calls on cohort sizes or apprenticeship slots. Those quarterly check-ins help keep the training plan tied to what’s actually happening as projects slip, speed up, or fall through.
Step 2: Align Curriculum, Credentials, and Safety Requirements
Once demand is clear, the next move is simple: line up training with the jobs employers need to fill. Start with the occupations that showed the biggest gaps in Step 1. Those should be the first programs you rework.
Create an Advisory Group to Define Job-Ready Skills
Bring together a small advisory group to define what first-year workers need to do on the job. Include faculty, employers, safety leads, HR, and union or apprenticeship partners.
The group’s main task is to run a job task analysis (JTA) for each priority occupation. In plain English, that means looking at job descriptions, talking with foremen, and writing down what a new hire must handle in year one. Then the group turns those tasks into competencies. That can include reading construction drawings in imperial units like feet and inches, torqueing bolts to spec in ft-lb, or performing lockout/tagout procedures. For each one, the group should also set performance standards and clear safety expectations.
This group should meet at least twice a year and work from a formal charter. That charter should name the priority occupations, required competencies, safety expectations, and credential requirements. The end product should be a competency matrix that maps tasks to performance standards and safety requirements.
Use that matrix to decide which courses, labs, and credentials need updates first.
Map Courses to Credentials and Work-Based Learning
Review courses against the credentials employers expect at hire. In construction and general industry, that usually means OSHA 10 for entry-level workers and OSHA 30 for supervisors or workers with added safety duties. In the craft trades, NCCER modules like Core, Electrical, Welding, and Heavy Equipment are widely recognized. In energy and extractives, common requirements include MSHA New Miner training, state electrician or crane operator licenses, and certifications such as IADC RigPass for oilfield settings.
The key is to build credential prep into current courses instead of tacking on separate classes. Joliet Junior College‘s CEJA Workforce Program is a good example. Its free bridge training pathway combines OSHA 10, CPR, and NCCER Core Construction content into one path, so students earn safety credentials and craft basics at the same time.
Work-based learning should match that same setup. Pre-apprenticeships give students core credentials and lab practice before they move into registered apprenticeships. In those apprenticeships, on-the-job training hours are formally tracked for wage progression and licensing eligibility. Registered apprenticeships can include 640+ classroom hours and up to 8,000 on-the-job hours over several years.
Labs should look and feel like the field. Students should practice the same work they’ll be expected to do on site, such as:
- Laying out work in feet and inches
- Setting forms to grade
- Torqueing bolts to spec in ft-lb
- Operating simulated pipelines while monitoring PSI and temperature in °F
- Completing incident documentation the same way they would on an actual site
Traditional Curricula vs. Industry-Driven Program Design
Placement gets faster when employers help shape the curriculum. Programs built on verified job task analyses, recognized credentials, and built-in safety requirements produce graduates who show up ready to work, not waiting for day-one training.
Once that alignment is set, the next step is to lock in the roles, funding, and placement systems that move students into jobs.
Step 3: Build Durable Partnership and Placement Systems
With curriculum aligned, the next challenge is making placement repeatable, not tied to one contact or an informal handoff.
Formalize Roles, Funding, and Decision-Making
Once training content is aligned, the partnership needs a clear operating structure. Start with a planning meeting with employer partners and work through the details that shape hiring:
- targeted occupations
- certification requirements at hire
- projected hiring volume
- peak hiring periods
- wage ranges
- preferred entry points, such as internships, pre-apprenticeships, or registered apprenticeships
The goal is simple: leave the room with concrete annual training targets and a shared definition of job-ready.
Then put it in writing. An MOU should spell out:
- targeted occupations
- annual enrollment and placement targets
- funding commitments
- data-sharing rules
- review cycle
- outcome metrics
From there, move into a quarterly decision process. A steering committee made up of college leadership, employer representatives, and workforce board contacts should meet every quarter to review the pipeline dashboard, approve curriculum updates, and make resource decisions.
For individual programs, such as lineworker training, heavy equipment, and pipeline operations, a separate technical advisory committee of frontline supervisors and HR leads can review competency requirements and commit to interview slots each semester.
Design Apprenticeships, Internships, and Jobsite Handoffs
After governance is set, the next job is getting students into roles without drag. Define entry requirements, employer commitments, and wage progression before students apply. Tie training calendars to project calendars so interviews, placements, and transitions into longer-term roles line up with peak construction or turnaround seasons.
Wages should be shared in U.S. dollars, with a clear path across internships, pre-apprenticeships, and apprenticeships.
Jobsite handoffs also need a written checklist:
- certifications confirmed
- screenings complete
- site safety orientation scheduled
- employer and college contacts named
Set expectations early on who notifies the student, who tracks the start date, and how last-minute changes are handled. That cuts down on no-shows and start-date delays.
Use ABLEMKR to Support Workforce Deployment and Compliance
When placement volume grows, manual coordination becomes the bottleneck. ABLEMKR matches pre-vetted workers to open roles based on verified certifications, safety training, availability, and geo-location. That helps speed up intake, verification, and mobilization for construction, energy, and extractives projects.
Employers get real-time visibility into worker status, streamlined onboarding workflows, and payroll tracking and on-time pay. Workers get clear access to well-paid opportunities without the friction that usually comes with manual deployment.
Those placement records should feed the outcome review in Step 4.
Step 4: Track Outcomes and Adjust the Pipeline Over Time
Use the placement data from Step 3 as your starting point, then review results on a set schedule. The goal is simple: don’t let the pipeline run on autopilot. Use the dashboard from Step 1 and the placement records from Step 3 to keep the review cycle up to date.
Measure Completion, Placement, Retention, and Wage Growth
Four metrics tell you whether the pipeline is leading to jobs, long-term stay rates, and better pay:
| Metric | What to Measure | Practical Target |
|---|---|---|
| Completion | Credentials earned vs. enrollments | 70–80% for short-term certificates |
| Placement | Graduates employed in a related occupation within 6 months | 75–90% for high-demand trades |
| Retention | Workers still in the industry at 12 and 36 months | 70–80% at 12 months; 60–70% at 36 months |
| Wage growth | Starting hourly wage vs. earnings at 3 years | 10–20% increase; e.g., $22/hr → $30/hr |
Some metrics matter more in some sectors than others. In construction, energy, and extractives, retention is the big one. In construction, 3-year retention is about 41%. That means getting someone hired is only part of the job. Keeping them in the field is the harder test.
For wage tracking, pull data from state unemployment insurance wage records matched to graduates, then add employer HR reports. That gives you verified figures without leaning on student self-reporting. All data sharing should follow FERPA guidelines and be covered by the data-sharing agreement in your MOU.
Use Real-Time Demand Signals to Update Programs
Outcome data tells you what already happened. Employer forecasts and job-posting trends tell you what’s about to happen. You need both.
When ABLEMKR job requirements show steady demand for a certain certification or trade, that’s a clear sign to change something now, not six months from now. You might need to increase recruitment, open another cohort, or update a credential map.
On the flip side, strong placement rates don’t always mean the pipeline is in balance. If one trade has slow time-to-hire or workers are taking jobs outside their field, that’s a sign of oversupply. If open requisitions sit unfilled for weeks, that’s a shortage. Either way, the fix starts with paying attention early.
Advisory committees should meet quarterly to review these signals and act on them. In practice, that can mean:
- Add seats
- Cut seats
- Add a safety module
- Shift a cohort schedule
Conclusion: Build the Pipeline Before the Labor Shortage Hits
The construction industry needs an estimated 499,000 new workers in 2026 alone. If colleges and employers wait until jobs stay open too long, they’ll spend months playing catch-up. The groups that plan ahead and use both outcome data and demand signals will be in a much better spot. They’ll fill major projects with workers who are safer, better credentialed, and more likely to stay.
Turn the review process into program changes, not just reports.
- Map demand early. Confirm priority trades and upcoming projects 1–3 years out.
- Align curriculum and credentials. Check that courses match current job descriptions for high-risk sites.
- Formalize placement systems. Set up apprenticeships, internships, and jobsite handoffs so teams can repeat them without reinventing the process each time.
- Track outcomes continuously. Measure completion, placement, retention, and wage growth at least once a year.
- Adjust capacity as signals shift. Rebalance seats and fine-tune support services as demand data changes.
Build the review cycle into the partnership from day one.
FAQs
How do colleges forecast local skilled trades demand?
Colleges forecast local skilled trades demand by studying labor market data. That gives them a clearer view of where jobs are headed and helps shape workforce spending and program planning.
They also work with industry leaders to line up curriculum with what local employers need. Through skills mapping and direct company feedback, schools can spot which certifications and trade specializations matter most. That way, programs stay in step with industry shifts and local hiring needs.
Which credentials matter most for entry-level trade jobs?
The credentials that matter most are the ones that show safety training and core technical skill. In many cases, employers look first for well-known safety certifications, such as OSHA training, along with any state-specific licenses required for specialized work.
A registered apprenticeship also carries a lot of weight because it blends hands-on jobsite work with classroom instruction. On top of that, certifications in Bluebeam, Procore, and AutoCAD can make a candidate more appealing by showing they’re comfortable with digital tools.
What metrics show whether a labor pipeline is working?
Track the metrics that show whether the program is driving growth, ROI, and day-to-day results, including:
- enrollment, active participants, and completers
- retention rates, plus skill or productivity gains
- wage growth and ROI, such as $1.44 to $1.47 returned for every $1 invested
It also helps to measure certification rates, safety compliance, apprentice labor-hour requirements, and time-to-hire or onboarding speed. Those numbers show whether the talent pipeline is cutting delays and bringing in workers who are ready to do the job.


