
Construction jobs often go over budget because field data reaches the office too late. I’d sum this up in one line: if your drawings, RFIs, change orders, labor hours, and cost codes are not in one live system, cost drift starts fast.
Here’s the short version of what matters:
- Major projects can finish 20% late and up to 80% over budget
- Rework often eats up 5%–10% of project value
- Slow RFIs and weak file control can turn small field issues into big cost hits
- Daily reporting, clear approval paths, and one cost-code structure help teams spot overruns sooner
- Portfolio dashboards help leaders compare active jobs and move labor where needed
- Baseline vs. post-rollout KPI tracking is how I’d judge whether the system is saving money
If I were setting this up, I’d focus on four things first:
- One source of truth for drawings, specs, RFIs, and changes
- Role-based access so the right people submit, review, and approve
- Daily field reports for labor, materials, equipment, and production
- KPIs like RFI aging, change-order cycle time, rework cost, labor output, and timecard correction rate
A few numbers show why this matters. One example in the article shows RFI response time dropping from 68 hours to 24 hours, with delay costs falling by $120,600 per month. Another shows rework on a $25 million project dropping from 3.2% to 1.8%, which equals $350,000 in direct cost savings.
Quick comparison:
| Focus area | What I’d set up | Cost problem it helps reduce |
|---|---|---|
| File control | One current drawing set, archived old versions, mobile access | Rework and version mistakes |
| Workflows | Issue → RFI → change order → budget update | Scope creep and missed cost impact |
| Team roles | Separate intake, review, pricing, and approval | Bad coding and weak review |
| Field reporting | Same-day labor, material, equipment, and production logs | Late cost visibility |
| Portfolio tracking | Shared cost codes across all jobs | Hard-to-compare job data |
| KPI review | Baseline vs. post-rollout measurement | Weak proof of ROI |
So the core idea is simple: cloud collaboration lowers cost problems when teams use one live system, log field data the same day, and tie each update to budget impact. The rest of the guide shows how I’d set that up in a clear, repeatable way.
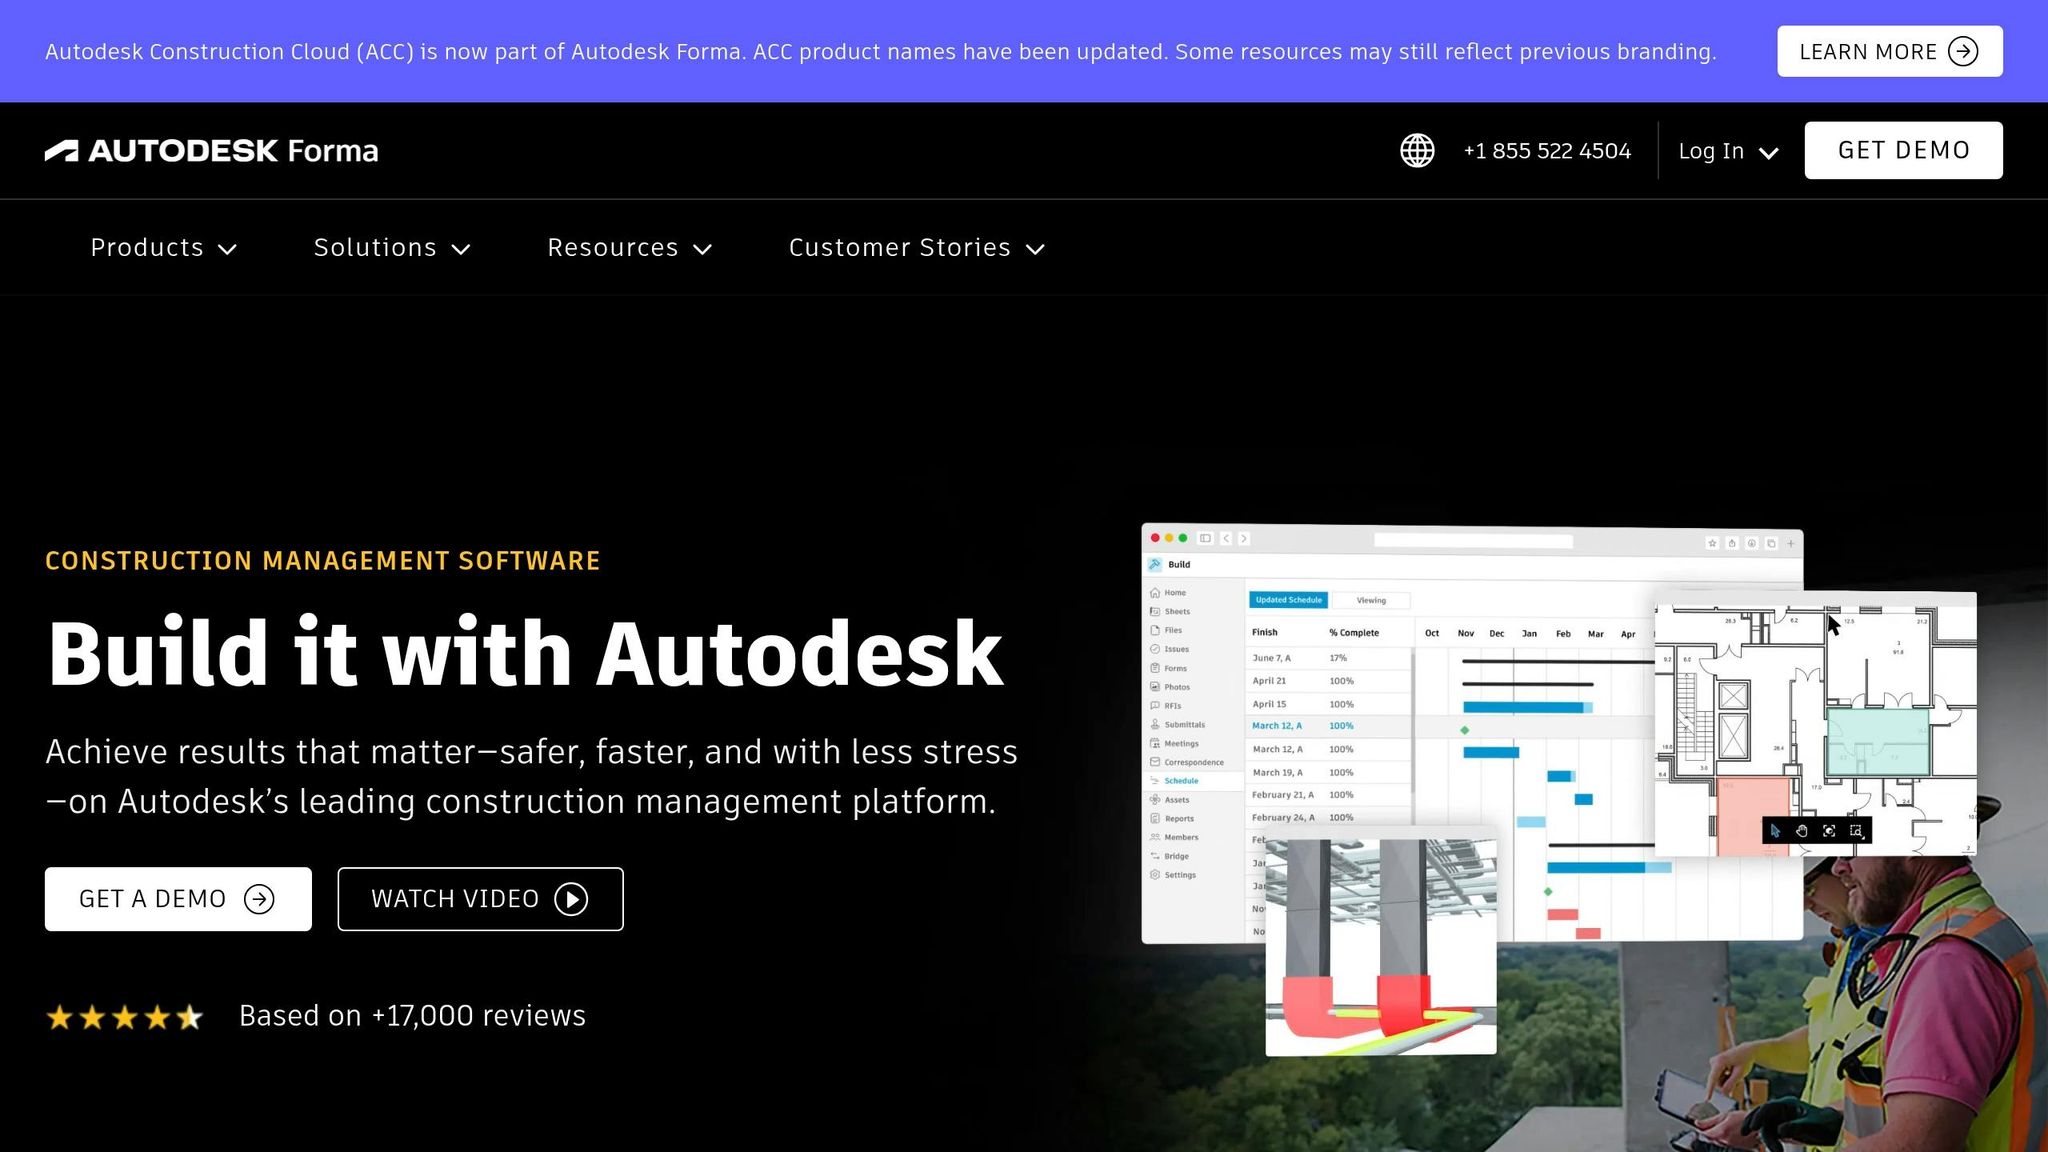
Webinar: Autodesk Construction Cloud | Introduction to Cost Management
sbb-itb-aa28329
Choose and Configure Cloud Tools for Cost Visibility
Once project data is live, the next move is setup. Every update needs to land in the right cost bucket. That means picking tools that turn field activity into budget updates, cost-code entries, and forecast changes in real time. If a platform can’t connect issues to cost codes and forecast impact, it won’t do much for cost control.
Features That Directly Affect Cost Tracking
Focus on features that connect field activity to budget impact. Tools that create change events from RFIs, sync approved changes into the budget, and remove duplicate entry for contract changes can improve cost control fast.
Here’s how the main feature groups connect to cost outcomes:
| Feature | Cost-Control Outcome |
|---|---|
| Budget, commitment & forecast tracking | Earlier variance detection; real-time exposure view |
| Change events & change orders | Prevents unapproved scope creep and margin leakage |
| Mobile/offline field reporting | Accurate labor, equipment, and production data from the site |
| Issue & RFI tracking | Faster resolution; fewer assumptions driving field work |
| Role-based permissions | Reduces unauthorized edits and accidental approvals |
| ERP/accounting integration | Speeds up billing; eliminates duplicate data entry |
Of course, features alone don’t fix anything. The project has to be set up so people use them the same way every time. That’s where many teams slip. The data supports the point: firms using project controls technology report up to a 36% reduction in rework, and integrated platforms can improve cost control by up to 35% through better forecasting and earlier issue detection.
Standard Setup: Permissions, Folder Structure, Cost Codes, and Templates
Good setup creates a clear line between teams that manage cost well and teams that are always cleaning up a mess later.
Start with a role-based permission matrix. Field staff should submit. Project managers should route. Cost staff should review the numbers. Executives should see portfolio-level summaries. Keep access tied to role, and limit approvals to named reviewers. That cuts down on accidental edits and approval mistakes.
Use the same folder structure on every project. A common setup looks like this:
- Contract
- Drawings
- Specifications
- Estimate & Budget
- Procurement
- Field
- Safety
- Closeout
This kind of structure helps files line up with audits, billings, and closeout work. It also helps to use one standard root folder name, such as "JobNumber – Client – Project Name", so teams aren’t hunting through random naming styles.
Cost codes matter just as much. Use one CSI-based cost-code list across project management and accounting so field entries post cleanly to job costs. Then match approval statuses to actual control points: Draft, Submitted, In Review, Approved, Rejected, Posted. When every project starts from the same template, reports are easier to compare across jobs.
Where ABLEMKR Supports Labor Cost Accuracy

Labor usually makes up 15–30% of total project cost for self-perform general contractors. It’s also one of the hardest cost categories to pin down. Crew availability shifts. Certifications expire. Onboarding can drag. One change in staffing can hit the budget fast.
That’s where ABLEMKR comes in.
ABLEMKR works as a workforce operations layer focused on labor accuracy. It matches pre-vetted workers to job sites based on certifications, safety training, availability, and geo-location. In plain English, it helps teams confirm the right crew before mobilization. Real-time worker status, integrated payroll workflows, and built-in compliance tracking help cut down on surprises in the labor cost column.
The payoff is simple: labor costs stay current in the budget instead of getting fixed later. That also helps keep labor data lined up before approvals, change events, and closeout workflows begin.
Build Cost-Focused Workflows and Assign Clear Team Roles
Once the platform is set up, the next step is simple in theory and messy in practice: decide who touches each record, what data follows it, and how fast it needs to move. That’s how every issue, RFI, and change turns into a tracked cost event instead of a budget surprise later.
Core Workflows: Issue to RFI, RFI to Change Order, and Approval to Closeout
Most avoidable overruns start small. A field issue isn’t logged right away. An RFI sits too long. A change gets approved before anyone ties a price to it. That’s where jobs start leaking money.
The handoff from field discovery to closeout should follow the same path every time. A field supervisor or foreman logs the issue at once with photos, location, date/time, cost code, and a short note on the impact. Then the project manager or coordinator reviews it and decides what it is: a scope clarification, design conflict, site condition, or a change that affects the budget. If the design team needs to respond, that item becomes an RFI.
If the answer changes scope, quantity, sequence, or means and methods, the record should move again – this time into a change-order request. That request needs estimated labor hours, material quantities, equipment impacts, schedule effect, and any contingency use. Once approved, the change should flow into the cost report, commitment log, and as-built or closeout record so the full money trail stays connected: issue → RFI → change order → budget update → closeout.
At a minimum, each record should carry:
- Cost code, trade, location, labor hours, crew size, material quantity, equipment usage, schedule impact, status, owner, and approval date
- For change-related items, estimated vs. actual cost, contingency use, contractual basis, markup, and whether it affects lump sum, GMP, or T&M billing
Research summarized by PlanGrid found RFIs can add $800,000 or more in delays and extra costs on a single large project.
That’s why automated routing matters so much. In one case study, average RFI response time dropped from 68 hours to 24 hours after routing was automated – a 65% reduction. Monthly delay costs also fell from $189,000 to $68,400, for savings of $120,600 per month.
Role Design for Field Supervisors, Project Managers, Cost Staff, and Approvers
Cost control usually falls apart when the same person both documents and approves the item. A second set of eyes is what catches missed scope, wrong cost codes, and changes that are priced too low before they hit the budget.
| Role | Data Entry | Document Review | Pricing Validation | Budget Impact Review | Approval Authority | Common Risk Points |
|---|---|---|---|---|---|---|
| Field Supervisor | Primary | Limited | None | Flags issues | None | Incomplete data entry; delayed reporting |
| Project Manager | Limited | Primary | Limited | Primary | Threshold-based | Misclassifying changes; slow routing decisions |
| Cost Staff | Limited | Primary | Primary | Primary | None | Wrong cost codes; missed budget exposure |
| Approver | None | Final review | None | Final review | Final authority | Approving without full backup documentation |
A clean setup looks like this: field supervisors handle intake, project managers make scope calls, cost staff check pricing and budget impact, and approvers make the final call.
Approval Paths by Dollar Threshold and Risk Level
Not every change needs four signatures. If you treat a $2,000 field fix the same way as a six-figure GMP adjustment, the process bogs down fast.
A practical approval path uses dollar thresholds first and risk level second. A low-value change with standard backup may only need the project manager and the owner’s rep. A higher-value change – or one tied to critical path work, safety conditions, or contract entitlement – should move through field validation, project manager review, cost manager sign-off, and executive approval no matter the dollar amount.
| Approval Type | Typical Threshold | Use Case | Key Tradeoff |
|---|---|---|---|
| One-step | Low-value, low-risk items | Minor field corrections, repeatable material substitutions | Fast, but higher risk of incomplete backup |
| Two-step | Mid-range value or schedule impact | Subcontractor scope additions, design clarifications with cost | Balanced speed and review |
| Multi-step | High value, critical path, or contract-sensitive | GMP adjustments, owner-directed changes, safety-related scope | Stronger control and auditability; slower cycle |
The key is writing the rules down so nobody has to guess when escalation is needed. Spell out the trigger points: dollar threshold, schedule impact, safety impact, and contract type. The point isn’t just moving things faster. It’s making sure unpriced scope never slides into approval. When teams don’t have written rules, approvals get inconsistent and scope creep follows. Those same rules also shape daily file sharing, field reporting, and portfolio tracking across active jobs.
Run Daily File Sharing, Field Reporting, and Multi-Project Cost Tracking
Daily execution only keeps cost in check when current files, same-day field data, and portfolio rollups all sit in one live system. Once workflows and approvals are set, the next place to tighten things up is daily file control and same-day reporting.
File Sharing Rules That Cut Rework and Version Errors
Wrong drawings lead to rework, so keep one current set as the source of truth.
That means every drawing, spec, submittal, RFI response, and change directive should sit in a controlled folder structure with clear revision labels. Superseded versions should be archived and hidden from field users. New revisions should only be published by designated document controllers or project managers. Everyone else should have read-only or download access to the current set.
Access should also be limited by scope. It cuts clutter and lowers the chance of accidental edits. Mobile access helps fill the gap that printed sets leave behind, especially when a revision changes in the middle of the day. If a foreman or superintendent can pull up the current drawing on a smartphone or tablet, even in a weak-signal area through offline mode, there’s a much better chance the crew works from the right information.
One simple habit goes a long way: foremen check the platform each morning for overnight RFI responses or revised details before crews start work.
Once the current set is under control, the next move is to capture field activity before the day is over.
Daily Field Reporting for Labor, Materials, Equipment, and Production
Daily field reports turn jobsite activity into cost data. They also show overruns within days instead of weeks.
Each report should include the project name, location, a unique report ID, and the date in MM/DD/YYYY format. Weather should be logged in °F, along with precipitation, wind, and any hit to production, like a concrete pour delayed by heat and finishing concerns. After that, the report needs to track four main cost drivers: labor, materials, equipment, and production quantities.
Here’s what that looks like in practice:
- Labor: crew lists by trade and company, hours worked by crew, and the cost codes tied to those hours
- Materials: quantities delivered and installed, tied to cost codes, with damaged or short deliveries flagged
- Equipment: which units were on site, hours used for each, and whether any were idle
- Production: actual quantities completed versus planned, using standard U.S. imperial units like SF, LF, and CY
| Reporting Level | Data Captured | Time to Detect Overruns | Best For |
|---|---|---|---|
| Minimal | Headcount and total hours, with generic notes | Month-end or later | Small, low-complexity jobs |
| Standard | Hours by cost code, major quantities, deliveries, equipment usage, weather | Days to weeks | Most projects |
| Advanced | Standard data plus tagged photos, per-crew metrics, delay reasons, and links to RFIs and pending changes | Within days | Complex multi-project portfolios |
Mobile-friendly forms make this much easier. With pre-populated project data, dropdown cost codes, and required fields for labor hours and production quantities, a foreman can finish a full report in 5–10 minutes on a smartphone. Set-time submission reminders and a midnight edit lockout help keep reports contemporaneous and auditable.
Those daily reports then feed the portfolio view across active jobs.
Portfolio-Level Views Across Active Projects
A portfolio dashboard shows which jobs are healthy, which ones are drifting, and where labor should be moved.
The starting point is a shared cost code structure across all projects. If every job uses the same codes, the dashboard can roll up data in a way that makes sense, like comparing labor productivity across sites or flagging portfolio-level exposure that needs executive attention. Without that standard setup, the portfolio view turns into noise.
ABLEMKR can feed real-time worker status into the portfolio dashboard so labor, payroll, and compliance stay aligned across sites.
That live portfolio view sets the baseline for measuring savings in the next section.
Measure Financial Results and Refine Your Process Over Time
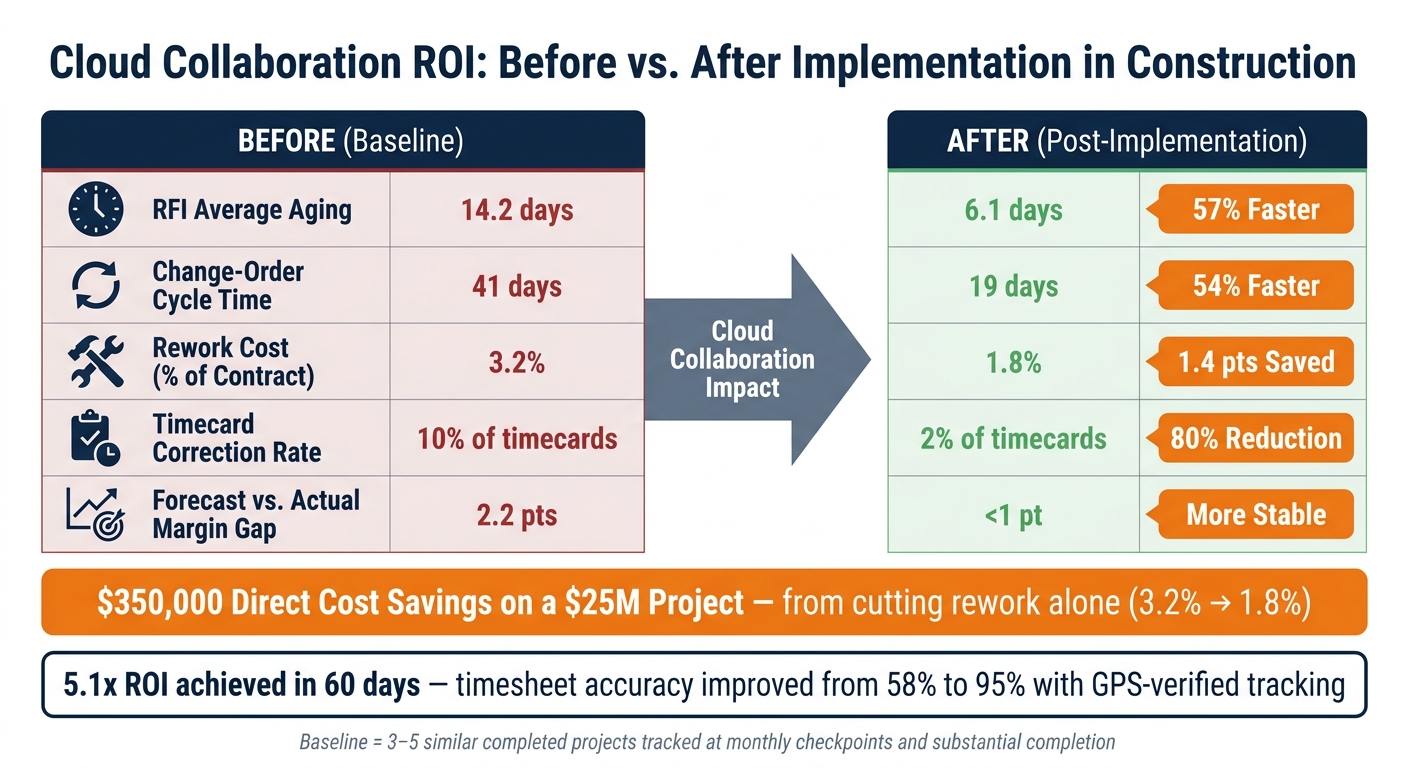
Cloud Collaboration ROI: Before vs. After Implementation in Construction
Track KPIs That Show Whether Collaboration Is Saving Money
Use your portfolio dashboard to watch the small set of metrics that tell you if cloud collaboration is cutting cost leakage. Then go one step further: check whether those workflows are reducing rework, delays, and labor loss in day-to-day operations.
For U.S. contractors running several jobs at once, these are the numbers that matter most:
- Cost variance by cost code – actual vs. budget in dollars and percentage for each code. Target: 80%–90% of cost codes within ±3%–5% of budget on active jobs.
- RFI aging – average number of days an RFI stays open. Target: answers within 48–72 hours. Anything past 72 hours is a warning sign. Each unresolved RFI can cost $1,080–$2,400 to process, and a complex commercial project may generate 200–400 RFIs.
- Change-order cycle time – days from field identification to approved CO. Target: simple changes under $10,000 approved within 7–10 days through digital routing.
- Open exposure vs. remaining contingency – unpriced RFIs, open claims, and pending change requests compared with remaining contingency. If exposure hits 80%–100% of contingency, tighten approvals and field documentation right away.
- Labor productivity – crew hours per unit of work, used to spot variance against budgeted production.
- Timecard correction rate – percentage of timecards that need adjustment each pay period. Target: below 2%–3% with cloud-based labor reporting.
Compare Baseline Versus Post-Implementation Performance
Once you lock in the KPI list, compare it with pre-rollout results. That’s how you show the process is doing its job. KPI tracking on its own doesn’t prove ROI. You need a before-and-after view.
Use 3–5 similar completed projects as your baseline for approval speed, rework cost, timecard corrections, and forecast accuracy. Then track the same metrics on cloud-enabled projects at the same checkpoints, usually monthly and again at substantial completion.
Here’s what that side-by-side view can look like:
| Metric | Baseline | Post-Implementation | Improvement |
|---|---|---|---|
| RFI average aging | 14.2 days | 6.1 days | 57% faster |
| Change-order cycle time | 41 days | 19 days | 54% faster |
| Rework cost (% of contract) | 3.2% | 1.8% | 1.4 pts saved |
| Timecard correction rate | 10% of timecards | 2% of timecards | 80% reduction |
| Forecast vs. actual margin gap | 2.2 pts | <1 pt | More stable |
This gives teams a practical benchmark when they enforce file control, daily reporting, and structured approval paths. On a $25 million project, cutting rework from 3.2% to 1.8% means a $350,000 direct cost gain tied to collaboration practices. Put simply, cloud collaboration only cuts cost drift when teams measure the same numbers before and after rollout.
Studies estimate that rework and coordination failures can represent 2%–5% of total construction cost, with cloud-based collaboration platforms delivering payback periods of 12–18 months on mid-sized projects through rework avoidance and schedule gains.
One case makes the point pretty clearly. A mid-size contractor with 42 workers improved timesheet accuracy from 58% to 95% within 60 days after putting GPS-verified time tracking and automated payroll in place. That cut annual payroll losses from $61,400 to $7,200 and produced a 5.1x ROI on a $10,600 annual investment. You only see results like that if the starting point is documented in plain terms.
The next move is to turn those measurements into a repeatable operating standard.
Conclusion: A Clear Operating Standard for Better Cost Control
Cloud collaboration helps control construction costs when the whole system works together: tool setup, standardized cost codes, folder structures, role assignments, daily field data capture, and regular portfolio KPI reviews. No single part can carry the whole load.
The firms that improve margins treat this as an operating standard, not just a software rollout. When file control, approvals, labor reporting, and KPI review stay in sync, overruns show up sooner and forecast accuracy improves enough for leadership to step in early.
Start with a clean baseline. Set up your tools around your cost code structure. Then track the same KPIs the same way each time. That baseline comparison is what shows whether the system is saving money.
FAQs
How much can cloud collaboration reduce construction cost overruns?
Cloud collaboration tools can help reduce cost overruns because they give teams real-time visibility into what’s happening on a project. That means people can spot problems early and fix them before those problems turn into expensive delays or budget surprises.
The numbers back that up. Research shows a 31% reduction in cost overruns, and total project costs often drop by 10%–20%.
A big part of the impact comes from putting communication, labor data, and material tracking in one place. Instead of relying on guesswork – or waiting through 15- to 60-day data delays – teams can see what’s changing as it happens and make budget calls with far less uncertainty.
Which KPIs should I track first to prove ROI?
Start with Cost Variance and Cost Performance Index (CPI) to catch budget overruns early. A CPI below 1.0 means you’re spending more than the value of the work you’ve finished.
It also helps to watch labor hours against your original estimates. And keep change order impact under 10% of total revenue. If labor hours go more than 10% over estimate before 75% of the work is complete, that can point to productivity problems.
How do I get field teams to submit daily reports consistently?
Make the digital workflow simpler than the manual one. Keep training hands-on and tied to each role, using short 15- to 20-minute sessions that focus on one core function at a time.
Use mobile-first tools that work offline and sync later. Show teams how digital reports cut repetitive data entry, then collect feedback and adjust the process around day-to-day needs.


