
If I get seasonal labor forecasting wrong, I usually pay for it in overtime, delays, idle crews, or rushed hiring. In field-heavy industries, a small planning miss can turn into $1.50x to $2.00x overtime pay, open shifts, travel costs, and compliance issues fast.
Here’s the short answer: the best setup is not one tool. It’s a stack. I’d look at five tool types together:
- Labor analytics dashboards to spot demand, utilization, and labor cost patterns
- Scheduling and capacity tools to turn forecasted demand into crew plans
- Applicant tracking systems (ATS) to estimate hiring speed by role and location
- Geo-based labor maps to check local worker supply, wages, and travel distance
- Payroll trend reports to track overtime, absenteeism, and budget drift
A few numbers make the case:
- Median time-to-fill for many nonexecutive roles: 39 days
- Some roles can take 63 to 68 days
- Overtime risk often starts when crews run at 20% to 25% overtime for weeks
- Paid time off, overtime from absences, and replacement labor can average 15.4% of payroll
- Overtime alone can account for 5.7% of payroll
So if I were planning for summer builds, outages, turnarounds, or storm work, I’d want my forecast to answer five plain questions:
- How many people will I need?
- When will I need them?
- Where can I find them?
- What will they cost me?
- Can I staff the work without pay or compliance problems?
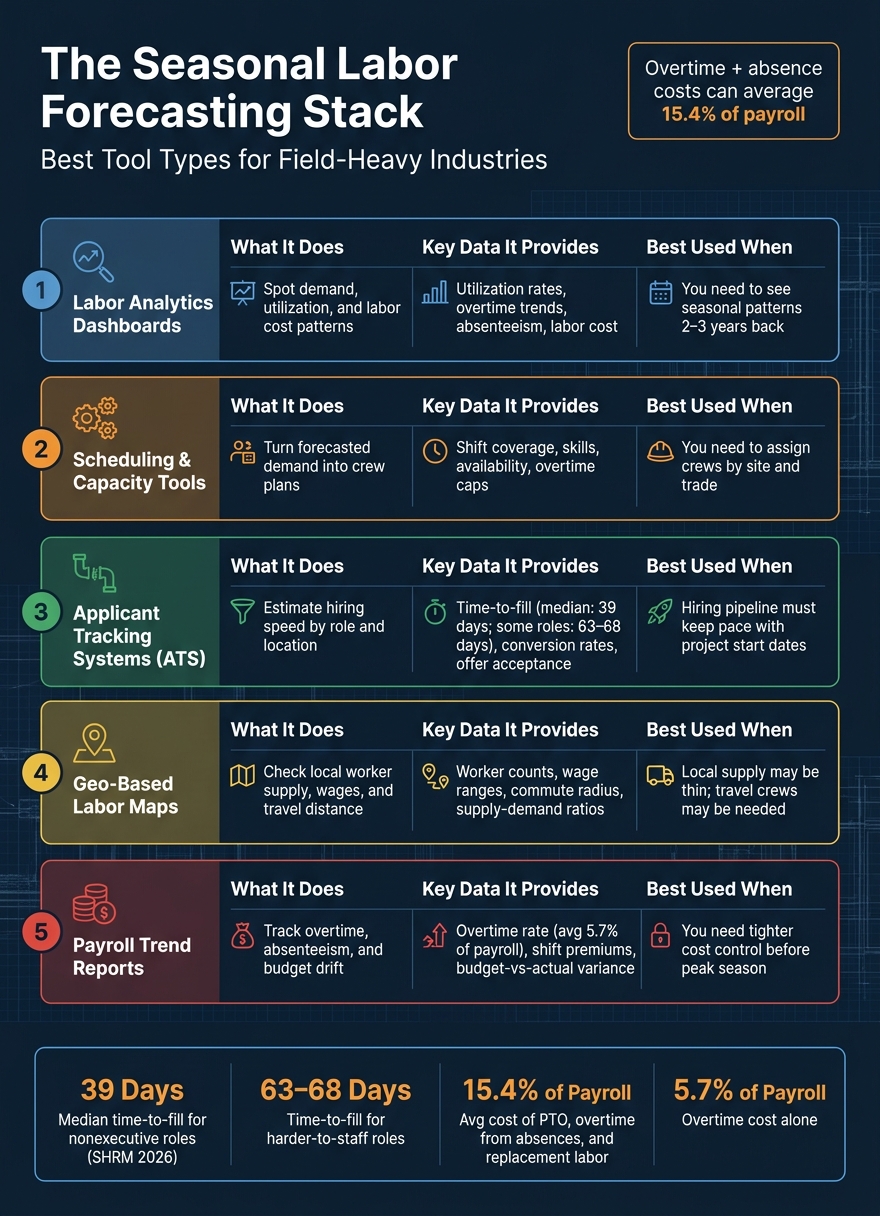
Seasonal Labor Forecasting Tool Stack: 5 Tool Types Compared
Quick Comparison
| Tool type | What I use it for | Main data it gives me | Best when |
|---|---|---|---|
| Labor analytics | Find demand and cost patterns | Utilization, overtime, absenteeism, labor cost | I need to see seasonal patterns early |
| Scheduling tools | Build crew plans | Shift coverage, skills, availability, overtime limits | I need to assign crews by site and trade |
| ATS | Track hiring pace | Time-to-fill, conversion rates, offer acceptance | I need to know if hiring can keep up |
| Geo labor maps | Check market supply | Worker counts, wages, commute radius, supply-demand view | I may need travel crews or wage premiums |
| Payroll reporting | Watch cost drift | Overtime, shift premiums, variance, absenteeism | I need tighter budget control |
| Integrated platforms like ABLEMKR | Connect staffing, compliance, and payroll | Worker status, certifications, location, pay workflows | I’m staffing across sites or regions |
My takeaway: the best seasonal forecasting tools help me plan demand, hiring, crew movement, and labor cost before peak season hits. The rest of the article breaks down which tools fit each part of that job.
sbb-itb-aa28329
Labor Analytics and Scheduling Systems
Labor Analytics Dashboards for Demand, Utilization, and Cost Trends
After you define demand sources, the next job is turning that input into a forecast people can actually use. That usually starts with a labor analytics dashboard.
A good dashboard pulls headcount, overtime, absenteeism, utilization, labor cost, and project schedule data into one place. That gives managers a clearer view of where demand is building, instead of spotting the problem when crews are already stretched thin.
The most useful dashboards also let you drill down from a companywide view to a region, site, trade, or shift. That level of detail matters. Seasonal demand almost never spikes evenly across every craft or location. Electricians may hit their busiest stretch during finish work, while equipment operators are busiest during site prep.
Use two to three years of historical data when possible to spot recurring seasonal patterns by month and project phase. UKG offers configurable dashboards and a KPI builder with roughly 150 workforce KPIs. For interval-level planning, Oracle Workforce Labor Optimization can forecast labor demand in 15-, 30-, or 60-minute increments.
| Tool | Primary Use Case | Planning Horizon | Data Granularity | Key Forecasting Features |
|---|---|---|---|---|
| UKG Dimensions | Enterprise workforce analytics | Weekly to multi-year | Site, team, individual | Configurable dashboards, overtime alerts, utilization trends |
| Oracle Workforce Labor Optimization | Interval-based demand forecasting | Short-term operational planning | Department, shift, trade | Labor standards integration, interval-level forecasting |
| Humanforce Analytics | Multi-site labor cost and compliance | Daily to monthly | Site, team, individual | Live attendance, actual vs. budgeted cost, compliance tracking |
| WorkAxle | Shift and hourly demand forecasting | Short-term to monthly | Shift, location | Automated seasonality modeling, holiday handling, granular interval forecasts |
| Quinyx | AI-driven demand and scheduling analytics | Weekly to quarter-ahead planning | Store, department, team | ML-based seasonal forecasting, scenario modeling, overtime cost tracking |
Scheduling and Capacity Planning Tools for Crew Allocation
Once demand is visible, scheduling tools turn that forecast into crew coverage. In plain terms, they take projected demand and translate it into crew assignments while factoring in worker availability, certifications, and overtime caps.
One of the biggest advantages is scenario planning. A planner can test what happens if a project starts two weeks early, demand jumps 15%, or absenteeism rises during peak season before any of that hits the jobsite. That matters because seasonal work can change fast. In energy and construction, even a small timing shift can throw crews and sites off balance.
Mobile access is a must for field-based teams. If schedules change in the middle of a project, supervisors and workers need updates right away.
| Tool | Best Fit | Planning Horizon | Mobile Capabilities | Forecast-Planning Features |
|---|---|---|---|---|
| UKG Dimensions | Multi-site shift operations | Daily to quarterly | Full mobile app for managers and workers | AI schedule optimization, overtime controls, demand-driven rostering |
| Oracle Workforce Scheduling | Large enterprise workforce operations | Shift to monthly | Mobile schedule access and approvals | Real-time demand signals, dynamic schedule adjustment, compliance rules |
| Quinyx | Multi-site seasonal operations | Weekly to quarterly | Full mobile app | What-if scenario modeling, skill-based assignment, seasonal ramp planning |
| Humanforce | Construction, utilities, and multi-site operations | Daily to monthly | Mobile rostering and time capture | Certification-based assignment, live compliance visibility, shift optimization |
One strong sign that a scheduling tool works well for seasonal operations is its ability to enforce skills and certification rules during assignment. That helps remove compliance risk before it reaches the field.
After demand and coverage are planned, the next issue is speed: how fast open roles can actually be filled.
Hiring Pipeline and Regional Labor Supply Tools
Once demand and coverage are mapped, the next step is simple: can the market supply those workers in time? That’s why seasonal forecasting works best when you pair applicant tracking data with regional labor supply data.
Applicant Tracking Systems for Seasonal and Project-Based Hiring
For seasonal planning, the ATS data that matters most is pretty practical: time-to-fill by role and location, the share of applicants who move from application to offer, offer acceptance rates, and which people are job-ready versus which ones still need training. With those numbers, staffing teams can work backward from the project start date and set requisition timing with a lot more confidence.
SHRM‘s 2026 benchmarking data puts median time-to-fill for nonexecutive roles at 39 calendar days, and some 2026 reports show averages of 63–68 days for certain roles. For peak seasons and project-based work, that means one thing: build the pipeline early.
It also helps to track returning seasonal workers. A rehire-heavy plan looks very different from a plan built around brand-new applicants, especially when you’re trying to estimate how much peak demand can be covered without starting from scratch.
Credential tagging matters too. If the system can tag candidates by OSHA 10/30, HAZWOPER, MSHA, or NCCER credentials, teams can see who is ready to work now and who still needs training. That makes it easier to estimate pre-season lead time and how much training capacity the forecast should include.
For this kind of hiring, a useful ATS should support:
- Talent pools and automated re-engagement
- Text-based outreach and recurring job templates
- Pipeline health reporting
- Integration with HRIS, payroll, background checks, and onboarding workflows
In heavy industry, ABLEMKR adds trade-verified candidate introductions, certification readiness visibility, and real-time worker messaging and location tracking.
That covers the pipeline side. The next step is checking whether the local labor market can carry the plan.
Geo-Based Labor Maps for Regional Supply, Wages, and Travel Planning
Once you know your pipeline capacity, the next issue is local supply. Is there enough labor near the jobsite, or do you need to bring people in? Geo-based labor maps help answer that by showing how many qualified workers are available within a realistic travel radius of each project site, along with what it may cost to get them there.
That matters fast in field operations. If local supply is thin for a given trade, the forecast needs to account for traveling crews before the project begins. That usually means adding travel pay, per diem, lodging, and wage premiums up front instead of scrambling later.
AGC‘s analysis of BLS data shows just how uneven labor conditions can be by region, with construction employment rising in 184 of 360 metro areas from April 2024 to April 2025.
Useful geo-based labor maps can show:
- Occupation counts and wage ranges
- Job postings and supply-to-demand ratios
- Commuting patterns and worker profile data
- Views by national, metro, county, ZIP code, or commuting-zone levels
The USDA classifies U.S. counties into 598 distinct labor market zones based on commuting flows. In many cases, that gives a better picture than metro boundaries, especially when a project pulls labor from a broad rural area.
Pair regional labor maps with ABLEMKR’s real-time worker availability, certifications, and geographic preferences to compare local supply against project demand before kickoff.
Payroll Trend Reports and Integrated Workforce Platforms
Payroll Trend Reporting for Overtime, Labor Cost, and Absenteeism Patterns
After supply mapping, the next question is cost.
Regional labor maps show whether workers are out there. Payroll trend reports show what those workers actually cost and where overruns begin to creep in.
When you look at multi-year payroll data by month, trade, and project type, patterns start to show up. Overtime spikes. Absenteeism jumps. Labor costs climb in the same parts of the year. That kind of history makes forecasts more grounded and a lot less hopeful.
The numbers that matter most are pretty clear:
- Overtime rate
- Cost per phase
- Shift premiums
- Absenteeism
- Budget-vs.-actual variance
The table below compares the tool types most often used for payroll trend reporting in seasonal workforce planning:
| Tool Type | Data Sources Used | Trend Analytics | Forecasting Outputs | Reporting Granularity |
|---|---|---|---|---|
| Enterprise HCM/Payroll Suite | Time clocks, payroll ledgers, job-costing codes, leave records | Seasonal overtime heat maps, shift-differential breakdowns, cohort comparisons | Budget projections, overtime risk scores, multi-state compliance alerts | Per trade, per site, per pay period, per project phase |
| SMB Payroll + Time Tracking | Mobile time entries, job codes, payroll exports | Per-project labor cost summaries, basic overtime flags | Job-level cost reports, simple budget-vs.-actual views | Per job, per employee, weekly or monthly |
| BI dashboards on payroll exports | Payroll exports, time-tracking data, project phase codes | Seasonality charts, variance analysis, custom predictive models | Scenario-based staffing forecasts, cost-per-phase projections | Fully configurable – trade, phase, region, or crew level |
What separates these tools isn’t just reporting. It’s whether the system can flag risk before the schedule is locked in.
Once those cost patterns are out in the open, the next move is to connect them to live deployment data.
Integrated Platforms Like ABLEMKR for Deployment, Compliance, and Real-Time Visibility

Historical payroll data gives you the cost envelope. But it can’t tell you whether enough certified welders are open in a given corridor in Q2, or how long it will take to mobilize a crew for a refinery turnaround.
ABLEMKR fills that gap. It brings together real-time worker availability, certification status, geo-location, and payroll workflows in one operating layer.
The table below shows how ABLEMKR lines up with seasonal forecasting and deployment needs:
| Capability | Details | Seasonal Forecasting Benefit |
|---|---|---|
| Deployment Focus | Pre-vetted workers matched to job sites across oil & gas, mining, utilities, and heavy infrastructure | Reduces time-to-staff for seasonal peaks, shutdowns, and remote project sites |
| Certification & Safety Matching | Workers matched by required certifications and safety training status embedded in profiles | Ensures crews meet compliance requirements before mobilization – no last-minute scrambles |
| Real-Time Worker Visibility | Live status on worker availability, location, and deployment across active projects | Allows planners to model realistic time-to-fill for seasonal roles and adjust lead times |
| Integrated Payroll Workflows | On-time payments and transparent cost structure for employers | Gives staffing teams a cleaner labor cost baseline for seasonal budget forecasting |
| Embedded Compliance Tracking | Compliance monitoring built into the platform, not bolted on after the fact | Reduces risk of incidents, regulatory fines, or project delays during high-volume seasonal surges |
| Mobile matching | Workers and employers connect via mobile app; geo-location used to match supply to demand | Speeds crew mobilization for last-minute shutdowns, pipeline repairs, or scheduled mine development |
Used together, payroll trend data and live deployment data give teams a much sharper planning edge. If payroll trends point to repeat overtime and live supply is tight, teams can book earlier, start training sooner, or shift noncritical work away from peak season before the rush hits.
How to Choose the Right Seasonal Forecasting Stack
Selection Criteria for Construction and Energy Staffing Teams
Now that the main tool types are on the table, the next step is simpler: pick the stack that matches your size, workload swings, and the kind of projects you run.
There’s no one-size-fits-all setup here. The right stack depends on your scale, demand volatility, and project mix. A small contractor can often get started with analytics and scheduling. A larger operation with crews spread across multiple sites usually needs forecasting tied across analytics, ATS, regional labor maps, and payroll in a single workflow.
Before you buy any tool, pressure-test it with a few direct questions:
- Does it integrate with current systems? It should ingest time, payroll, HRIS/ATS, and project data without breaking job codes.
- Can field teams use it? It should support mobile time, absence, and labor-request workflows from the field.
- Does it track certifications and compliance? It should show OSHA 10/30, MSHA, and HAZWOPER status before assignment.
- How granular is reporting? It should break out cost by trade, region, project phase, and pay period.
Use those criteria to figure out how much forecasting depth your team actually needs. A staged approach usually makes the most sense. Start with scheduling and analytics. Add ATS and geo-based labor maps when hiring readiness starts to matter more. Then move into integrated deployment, compliance, and payroll once work stretches across multiple sites or regions.
When the stack fits the way you operate, seasonal forecasting gets easier to trust and a lot easier to use.
Conclusion: The Most Useful Tool Categories for Better Seasonal Forecasts
Research from SHRM and Kronos found that the total direct cost of paid time off, overtime from absences, and replacement workers averaged 15.4% of payroll, with overtime alone accounting for 5.7%. That’s not a small leak. It’s the kind of cost drift that can eat into margins before peak season even starts.
A solid stack – labor analytics, scheduling, ATS, geo-based labor maps, and payroll trend reports – gives teams the data they need to cut into that number early. And for high-volatility operations, ABLEMKR connects deployment, compliance, and payroll in one workflow.
FAQs
What tools should I start with first?
Start by pulling your workforce data into one place. That means HR systems, training and certification records, project schedules, and external labor reports. Then layer in regional data like local wages, attrition rates, and demographic trends.
For day-to-day workforce management, use a mobile-first platform like ABLEMKR. It gives you real-time tracking, automated compliance, payroll workflows, and worker matching based on certifications, safety training, availability, and geo-location.
How far ahead should I forecast seasonal labor?
Forecast seasonal labor across 1-year, 3-year, and 5-year time frames. That gives you a clearer view of retirement waves, repeat seasonal demand spikes, and upcoming project phases before they hit.
It also helps to review performance metrics and forecasts every quarter. Project timelines can shift. New business approvals can change hiring plans overnight. A quarterly check-in lets you adjust early instead of scrambling later, which supports a more data-driven planning approach.
How do I reduce overtime during peak season?
Reduce overtime during peak season with proactive forecasting, real-time monitoring, and flexible staffing. Start with your past hiring patterns and project schedules. They can show you when demand tends to spike, so you can plan labor needs before hours start piling up.
Real-time dashboards make this much easier. You can spot excessive hours early and act fast by reallocating crews or adjusting shifts. And when workload jumps for a short stretch, bringing in short-term or contract workers can help you scale up without taking on long-term overhead.


