
Most crew problems start weeks before anyone acts on them. I’d sum up this topic like this: AI workforce forecasting helps you turn schedules, labor actuals, productivity rates, and site changes into trade-by-trade crew demand before labor gaps hit the job.
If I were explaining the article in plain English, I’d say it comes down to four things:
- Build the forecast from solid inputs like the CPM schedule, labor actuals, backlog, drawings, RFIs, and past production data.
- Map labor demand by phase and trade so you can see when concrete, steel, MEP, finishes, and support staff are needed.
- Set hiring and mobilization triggers when forecasted demand goes past available crews.
- Review forecast vs. actual every week so the model stays tied to what is happening on-site.
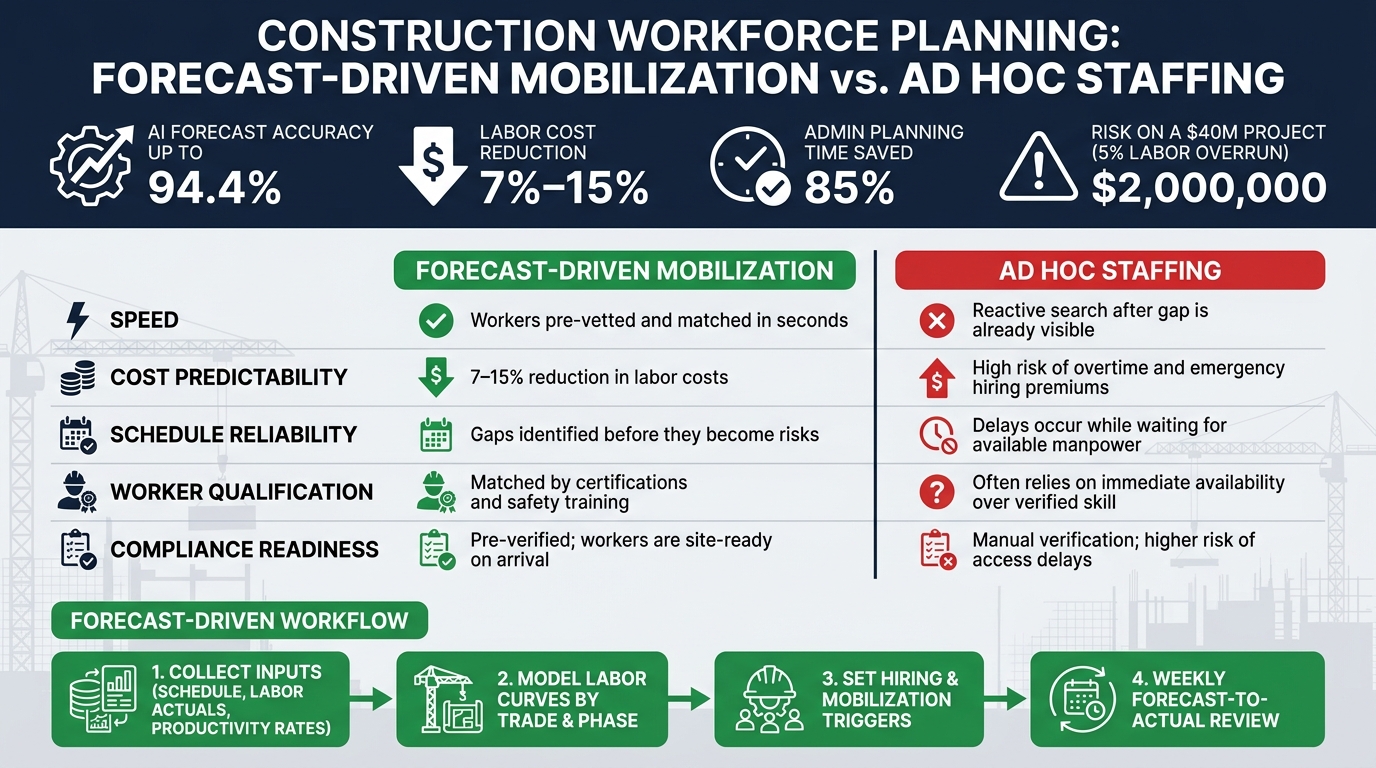
The numbers are the part that stands out. The article says AI-based forecasting can reach up to 94.4% accuracy, cut labor costs by 7% to 15%, and trim admin planning time by 85%. On a $40 million project, even a 5% labor overrun can mean a $2 million hit.
What I like about the article is that it stays focused on the jobsite. It’s not about making another dashboard. It’s about getting the right crew, in the right phase, at the right time – and doing it before delays, overtime, and last-minute hiring start eating into margin.
AI and the Future of Construction Workforce (ft. Darshit Jasani) | The Lumberyard Ep 6
sbb-itb-aa28329
How to set up an AI workforce forecast
A forecast is only as good as the data behind it. Before any model runs, project managers need solid inputs: project schedules, labor actuals, historical productivity rates, and committed near-term work. If the inputs are weak, the output will be too. The goal here is to build phase-by-phase labor demand, not just a single project total. Once the data is ready, you can turn it into labor demand by phase.
Collect the core inputs: schedules, labor actuals, backlog, and productivity rates
Start with the CPM schedule as the base for the forecast. Then layer in labor actuals from timekeeping systems and project controls, plus historical production rates by trade. On top of that, pull in the project records that explain what’s happening behind the schedule: drawings, past RFIs, submittals, and internal files.
That extra context matters. A schedule might say one thing, while job records show where work is slowing down, stacking up, or drifting. Current, job-specific data makes the forecast sharper and far more useful.
Choose forecast granularity based on the decision you need to make
The level of detail should match the decision in front of you. For field execution and near-term mobilization, use weekly forecasts at the role level. For hiring plans 12 to 18 months out, use monthly headcount forecasts.
Here’s the simple rule:
- Short-window operating decisions need weekly, role-level detail
- Longer-range workforce planning needs monthly, trade-level totals
If a superintendent needs to know who should be on-site next week, a monthly trade summary won’t help much. On the other hand, if leadership is planning staffing for next year, they don’t need daily crew swings. Match the forecast horizon to the phase or trade decision at hand.
Run scenarios for weather, delays, and scope changes
A single-point forecast assumes the job goes according to plan. That’s rarely how construction works. Run base, downside, and delay scenarios to show how weather, productivity, and scope changes shift labor demand.
This gives project managers a range instead of one number to bet on. And that range is what helps teams set hiring and mobilization triggers with a bit more confidence.
Those inputs and scenarios feed the labor curves by phase.
How to model labor curves and trade demand by project phase
Once the forecast is locked in, the next step is turning it into labor demand for each project phase. With the schedule, past productivity, and scenario inputs in place, AI can turn that data into labor curves. But it doesn’t decide which trades are needed, when they need to show up, or how long they should stay on site. That’s why phase-based labor curves matter so much.
Map labor curves from site prep through commissioning
Labor demand usually starts low, builds through the middle of the job, peaks before systems work, and then falls off during closeout. AI maps that curve by connecting productivity history to the CPM schedule, phase by phase.
A typical curve runs through site prep, foundations, structural framing, enclosure, MEP rough-in, interior finishes, and commissioning. Each phase has its own peak, and those peaks almost never line up neatly. That’s where things get messy on commercial jobs. Trade overlap is one of the most common sources of crew conflict. AI brings those clashes to light weeks ahead of time. The payoff is simple: teams can plan crews before labor demand spikes, not after the schedule is already getting squeezed.
That curve only starts to help when you break it down by trade demand.
Forecast each trade by phase
Trade-level forecasting is what makes the model useful in the field. Instead of one total labor curve, you get separate demand curves for concrete, steel, electrical, mechanical, plumbing, and finishes, each tied to the phase where that trade is active. Those phase-based trade curves show managers when each crew needs to mobilize, not just how heavy the project’s total labor load will be.
Productivity benchmarks keep these trade-level forecasts tied to expected output. That helps AI turn schedule activities into crew size requirements instead of rough guesses. AI forecasting built on project context can reach 94.4% accuracy and cut labor costs by 7%–15%.
The forecast also needs to account for the people behind the crews who keep each phase moving.
Include supervision and support roles in the labor curve
Supervision and support roles need to be part of the curve too. AI can match skills to demand and show available labor as phases shift, so the model reflects who is actually available as one phase hands off to the next.
During turnover and closeout, field crews shrink, but coordination work doesn’t disappear. In many cases, it ramps up in a different form. A forecast that tracks only field labor will understate the workload at closeout.
These curves then feed the hiring and mobilization calls that come next.
How to turn forecasts into hiring, mobilization, and deployment decisions
AI Workforce Forecasting vs. Ad Hoc Staffing: Key Metrics & Benefits
Labor curves and trade demand forecasts only matter if they lead to action. If the model shows a gap – say, a trade crew is needed before a peak phase – someone has to make that crew decision before the window shuts.
Set hiring and mobilization triggers from forecasted labor gaps
One of the simplest ways to use a forecast is to set a clear trigger. When forecasted demand goes past available internal supply by a set threshold – usually a full crew or a fixed labor-hour mark – a hiring requisition or redeployment order can fire automatically. That takes the guesswork out of timing. The gap stops being a warning on a screen and becomes a hiring or mobilization trigger.
AI forecasting can also track crew availability between phases. So if a crew is finishing work on one job, the system can flag that crew as available for the next start. That gives operations leaders a clean path: redeploy internal labor first, then hire only for the remaining shortfall.
Use forecast outputs to speed up onboarding and site readiness
Once a trigger fires, the next bottleneck is usually onboarding speed. The forecast has to move into the deployment workflow. It can’t just sit in the schedule.
Platforms like ABLEMKR are built to handle that handoff. When a forecast shows a need for certified workers at a certain site on a certain date, ABLEMKR matches pre-vetted workers based on certifications, safety training, availability, and geolocation. Compliance tracking and payroll workflows are built in, so workers show up site-ready without gate delays. The payoff is simple: faster mobilization and fewer compliance slowdowns.
Forecast-driven mobilization vs. ad hoc staffing
This is where the gap between planned staffing and reactive staffing gets plain. It shows up in speed, cost, schedule control, and compliance.
| Factor | Forecast-Driven Mobilization | Ad Hoc Staffing |
|---|---|---|
| Speed | Workers pre-vetted and matched in seconds | Reactive search after the gap is already visible |
| Cost Predictability | 7–15% reduction in labor costs | High risk of overtime and emergency hiring premiums |
| Schedule Reliability | Gaps identified before they become risks | Delays occur while waiting for available manpower |
| Worker Qualification | Matched by certifications and safety training | Often relies on immediate availability over verified skill |
| Compliance Readiness | Pre-verified; workers are site-ready on arrival | Manual verification; higher risk of access delays |
Ad hoc staffing tends to pile on access delays, overtime, and schedule risk down the line. Forecast-driven mobilization closes labor gaps before the next phase begins.
How to make AI forecasting part of normal business operations
Once forecasts start shaping staffing calls, the job shifts. Now you need to keep the model current.
Forecasting works best as a weekly operating habit, not a one-and-done model.
Build a review cycle with forecast-to-actual updates
The most useful rhythm is a weekly labor review tied straight to what’s happening on-site. Those check-ins help teams spot short-term gaps before they spill into the next phase. Then the latest labor actuals go back into the model, so it keeps getting better and hiring or mobilization calls stay up to date.
Keep labor actuals and schedules current. Just as important, give one person ownership of the forecast-to-actual loop. If nobody owns it, the review cycle tends to drift.
Track the KPIs that show forecast value
Track whether the forecast changes crew decisions, not whether it just fills up a dashboard. The KPIs worth watching are:
| KPI | What It Measures | Target |
|---|---|---|
| Forecast-to-Actual Accuracy | Forecasted vs. actual labor hours and crew counts | Up to 94.4% accuracy |
| Labor Cost Variance | Difference between planned and actual labor spend | 7–15% reduction |
| Manual Scheduling Time | Hours spent on administrative workforce planning | 85% reduction |
| Overtime Percentage | Unplanned overtime as a share of total hours | Trending down quarter-over-quarter |
| Mobilization Speed | Time from trigger to crew on-site | As short as possible |
Focus on decision speed and schedule impact, not dashboard activity. Then use those numbers to tighten the next planning cycle.
Conclusion: Key steps to plan crews earlier and mobilize faster
Start with clean schedule and labor data. Then build phase-based labor curves and role-level triggers. Every labor gap should connect to a clear trigger that kicks off a hiring requisition or redeployment order before the window closes.
Platforms like ABLEMKR are built to take that handoff. They match pre-vetted workers to open roles based on certifications, availability, and location, so crews show up site-ready.
AI forecasting does its best work when it connects straight to field execution. The goal isn’t a better report. It’s a crew on-site before the gap turns into a delay.
FAQs
What data do we need first?
Start with accurate, structured data in one platform. Your main inputs are worker profiles, project schedules, job site conditions, and cost data.
That means pulling together certifications, safety training, performance, and availability in one place. It also means tying those records to project timelines, milestones, required skills, locations, and past payroll, attendance, and productivity data.
Why does that matter? Because if this information lives in scattered spreadsheets, emails, and field notes, planning gets messy fast. One platform gives you a clear view of who’s qualified, who’s available, what the job needs, and what the work has cost before.
How far ahead should we forecast crews?
Forecast crews weeks or months ahead so labor lines up with upcoming project phases. Use historical data, project schedules, and market trends to plan staffing before the work hits.
Then pair that with a rolling three- to six-week look-ahead. This helps you adjust crew sizes and react to near-term disruptions before they turn into costly overruns.
How do forecasts turn into hiring decisions?
Forecasts shape hiring decisions when teams move from big-picture analysis to direct workforce planning. AI can estimate when and where labor will be needed by looking at project phases, past trends, and market demand. That gives managers a way to plan ahead instead of scrambling to hire at the last minute.
When connected to ABLEMKR, those forecasts can turn into clear job requirements and be matched with pre-vetted workers based on certifications, availability, and location. The result is simple: project managers can line up qualified crews when project milestones call for them.


